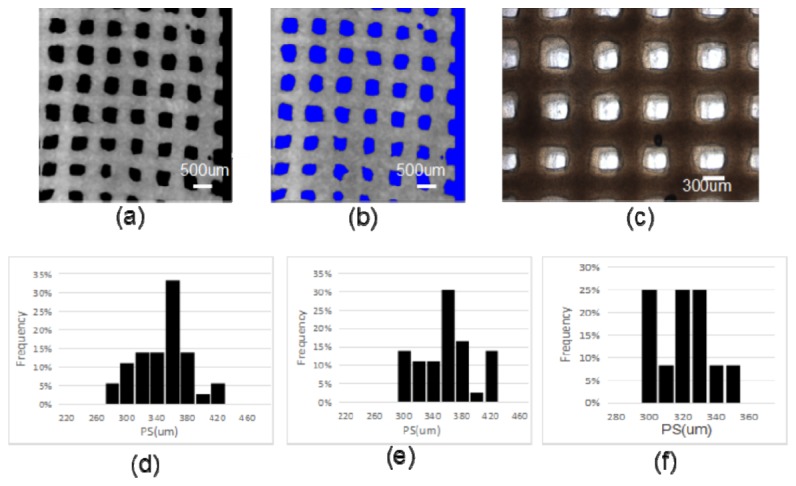
Fig. 7.

(a) a representative en face OCT image (XY) of R400 scaffold; (b) corresponding segmented image of (a), void region is highlighted by blue color; (c) a digital phase-contrast microscopy image of the same scaffold on the part of the same region. (d) Histogram of the estimated PS from the en face OCT image (a) by computer analysis with our proposed algorithm; (e) Histogram of the estimated PS from the same OCT image by a human observer; (f) Histogram of the estimated PS from the microscopy image (c).
