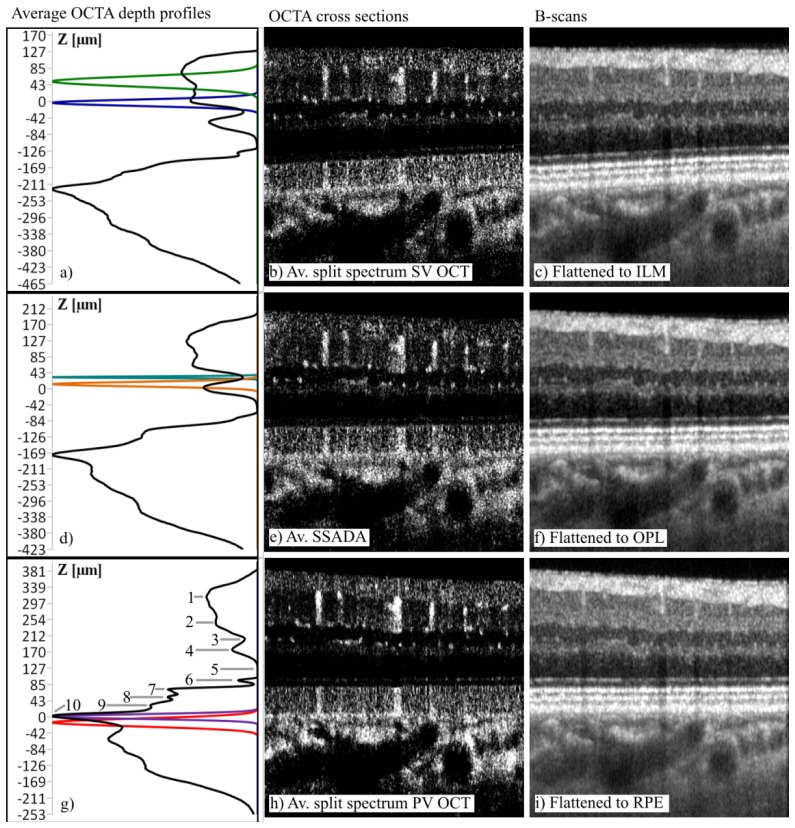
Fig. 2.
Demonstration of OCTA depth profiles and selection of depth ranges for generation of en face projections in subject N1. First row: split-spectrum SV OCTA data with volume averaging, flattened to the inner limiting membrane for visualization of the inner retinal vessels and inner capillary plexus. Second row: SSADA data with volume averaging, flattened to the outer plexiform layer for visualization of the outer capillary plexus. Third row: split spectrum PV OCTA data with volume averaging, flattened to the RPE for visualization of the choroidal layers. Gaussian curves indicate selection of depth ranges for generation of en face projections shown in Figs. 3, 4, 7: green - inner retinal vessels, blue inner capillary plexus, teal - inner nuclear layer vessels, orange-outer capillary plexus, purple-choriocapillaris, red- Sattler's layer. Numerical labels in g): 1 - nerve fiber layer, 2 - inner plexiform layer, 3 - inner nuclear layer, 4 - outer plexiform layer, 5 - outer nuclear layer, 6 - external limiting membrane, 7 - inner/outer photoreceptor segment junction, 8 - cone outer segments, 9 - retinal pigment epithelium, 10 - choriocapillaris. Image location: 6° nasal, 4° inferior relatively to the fovea. Geometric depth locations are given in Z axes in the depth profiles. Horizontal image sizes: 1.8 mm.

