
Fig. 4.
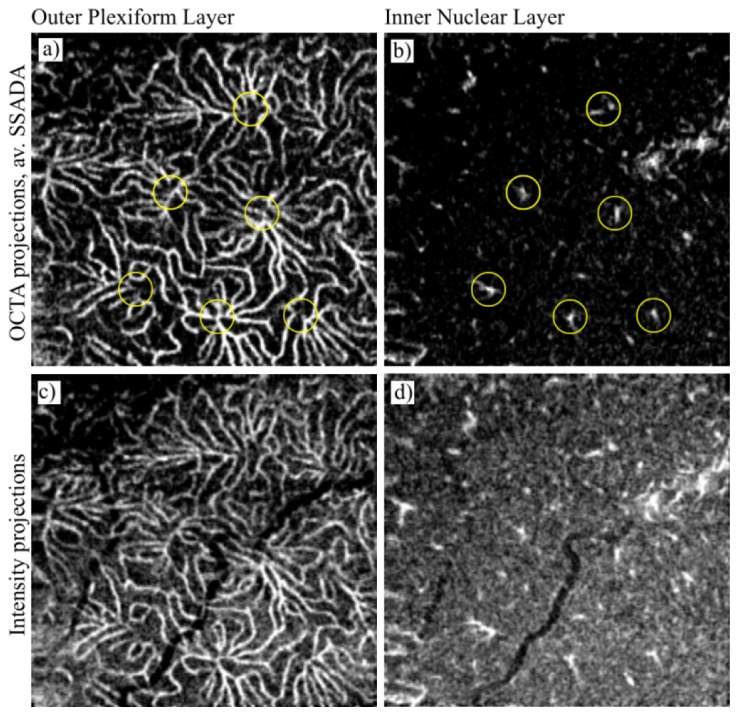
Overview of the retinal vascular layers obtained from subject N1 with the SSADA method with volume averaging. Top row: OCTA projections. Bottom row: intensity projections. Projections of the outer capillary plexus were obtained by Gaussian windowing of the data flattened to the outer plexiform layer as indicated by the orange line in Fig. 2(d). Projections of the inner nuclear layer vessels were obtained by Gaussian depth windowing indicated by the teal line in Fig. 2(d). Yellow circles in b) indicate selected vessels connecting the outer capillary plexus with the retinal vessels, associated with corresponding clusters of capillaries indicated in a). Image location: 6° nasal, 4° inferior relative to the fovea. Image sizes: 1.8 x 1.8 mm.