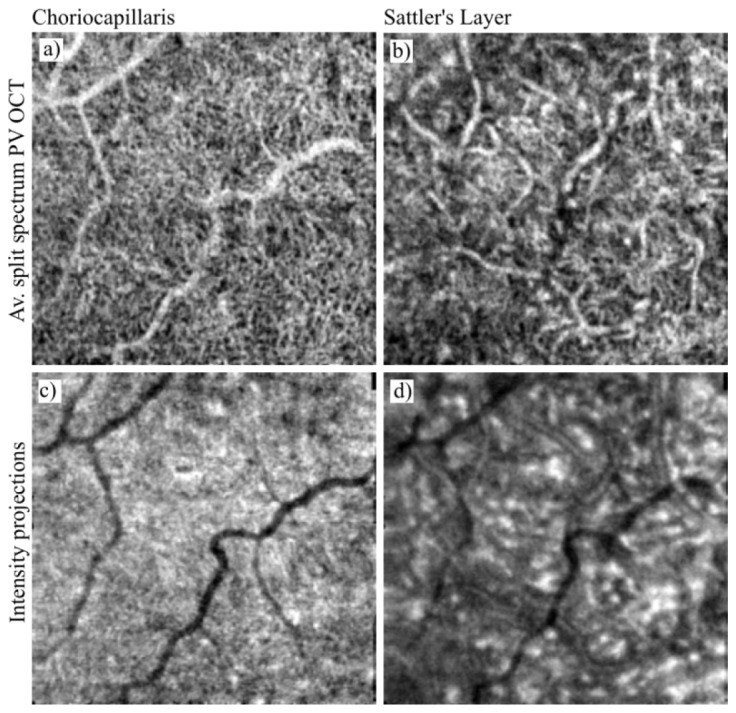
Fig. 7.

Overview of the choroidal vascular layers obtained in subject N1 with the split spectrum PV OCT method with volume averaging. Top row: OCTA projections. Bottom row: intensity projections. Projections of the choriocapillaris were obtained by Gaussian windowing of the data flattened to the RPE as indicated by the purple line in Fig. 2(g). Projections of Sattler's layer vessels were obtained by Gaussian depth windowing indicated by the red line in Fig. 2(g). Image location: 6° nasal, 4° inferior from the fovea. Image sizes: 1.8 x 1.8 mm.
