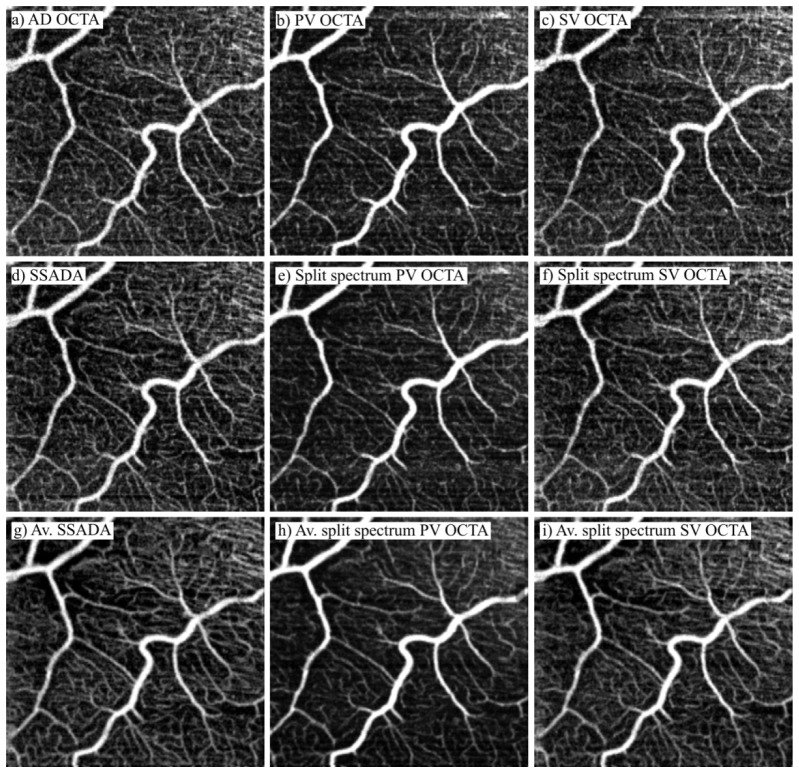
Fig. 10.
Comparison of performance of OCTA methods in imaging of the retinal vasculature in subject N1. First column: amplitude-decorrelation method. Second column: phase-variance OCT. Third column: speckle-variance OCT. First row: full spectrum, single volume data. Second row: split spectrum, single volume data. Third row: average (Av.) of 4 volumes obtained with the split spectrum data. Image location: 6° nasal, 4° inferior from the fovea. Image sizes: 1.8 x 1.8 mm.

