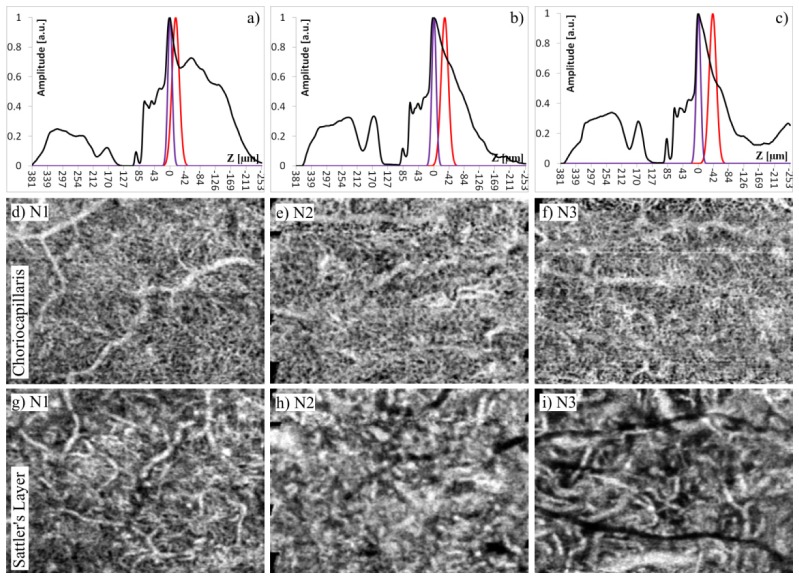
Fig. 16.
Comparison of OCTA imaging of the choroidal vasculature in three normal subjects. Images from different subjects are presented in columns. First row: OCTA depth profiles. Second row: OCTA projections of the choriocapillaris. Third row: OCTA projections of Sattler's layer. The Gaussian curves in OCTA depth profiles indicate depth windowing of the data applied for generation of the projections: purple line - choriocapillaris, red line - Sattler's layer. N1 image sizes: 1.8 x 1.8 mm located 6° nasal, 4° inferior relative to the fovea. N2 and N3 image sizes: 1.8 x 1.3 mm located 8° nasal and 4° inferior from the fovea.

