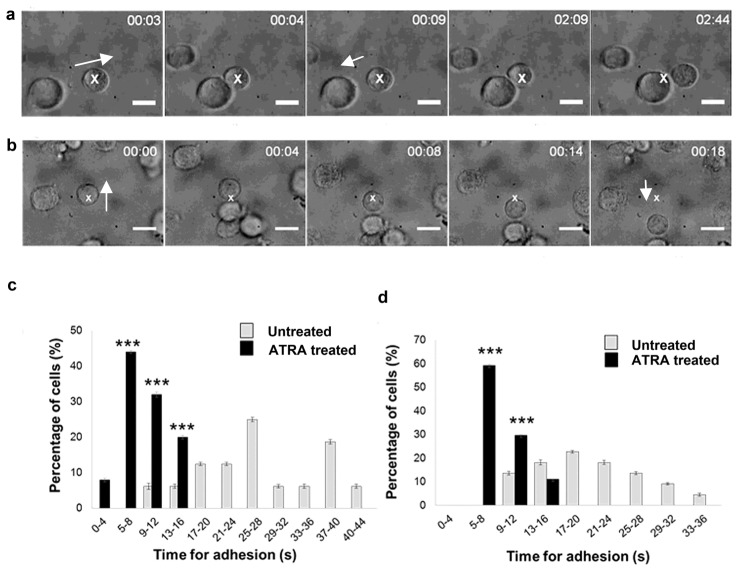
Fig. 2.
Dependence of minimum time for cell-cell adhesion on differentiation status of malignant cells. Time lapse images from real time movies depicting (a) an untreated C6 glioma cell made to approach another (Visualization 1 (2.7MB, MPEG) ). The trap is moved after every (n + 5) second where n = 0, 5, 10, 15 s. Cells were allowed to remain in contact till they could not be pulled apart by the trap: the time taken was designated the minimum time for cell-cell adhesion. The white cross denotes the trapped cell. In the first three frames, another cell is made to approach the trapped cell in the direction of the arrow. As the trap is moved away after 9 s, the cells are seen to separate. Eventually, the cells remain adhered to each other (last two frames). (b) Similar time lapse images from real-time movies for ATRA-treated C6 glioma cells showing adherence after 4 s contact (Visualization 2 (4.1MB, MPEG) ). (c), (d) Percentage of undifferentiated and ATRA-treated cells undergoing irreversible cell adhesion at different time points (see text). (c) SK-N-SH cells; (d) C6 glioma cells. *** denotes statistical significance where p<0.001 for adhesion times of untreated and ATRA-treated cells.

