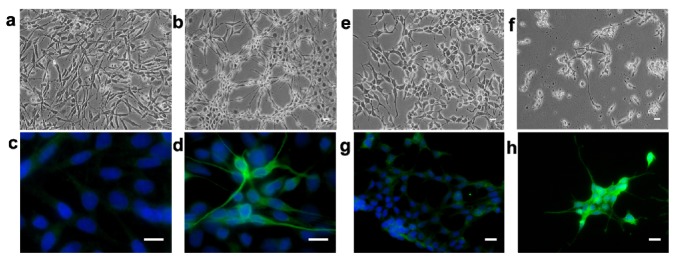
Fig. 3.
Bright-field microscopy images of (a) untreated and (b) ATRA-treated C6 glioma cells, and of (e) untreated and (f) ATRA-treated SK-N-SH neuroblastoma cells. Expression of GFAP in untreated C6 cells (c) and in ATRA-treated C6 cells (d). Expression of β-tubulin III in undifferentiated SK-N-SH cells (g) showing low expression in a few cells and in ATRA-treated SK-N-SH cells (h) with moderate or intense expression in most cells. The white scale bar denotes 10 µm.

