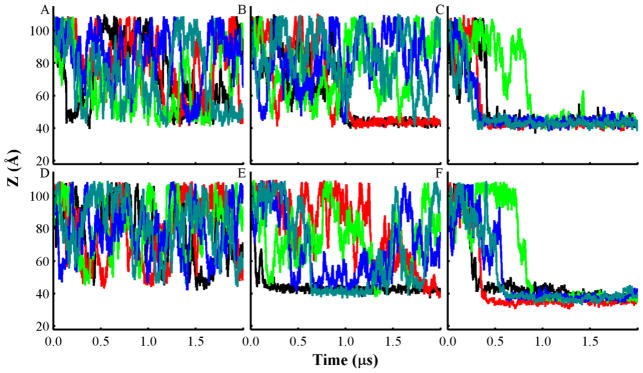
Fig. 2.
Plots of the center of mass (COM) distance (Z) between T-domain and lipid bilayers of different composition along the bilayer normal axis obtained from all unrestrained CG-MD simulations. Distance between the neutral pH structure and bilayers of the following composition and molar ratios: (A) POPC; (B) POPC:POPG 3:1; and (C) POPC:POPG 1:3. Distance of the low pH unfolded T-domain structure and bilayers of the following composition: (D) POPC; (E) POPC:POPG 3:1; and (F) POPC:POPG 1:3. Each line color represents an independent CG-MD production simulation, which is initiated with the same protein orientation and different seed number. Accumulated CG-MD production simulation time is 60 μs.

