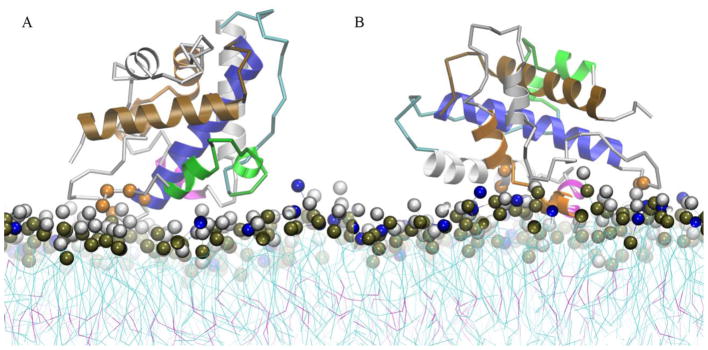
Fig. 7.
Structural representation of the intermediate membrane bound states along the free energy profile curves of the low pH T-domain structure in the presence of a pre-formed membrane containing POPC:POPG 1:3. Each representation corresponds to the last MD snapshot of restrained US simulations at COM distance of Z = 39 Å. (A) Ribbon representation of intermediate membrane bound state B1. (B) Ribbon representation of membrane bound state B2. Helices TH1, TH2, TH4, TH5, TH8 and TH9 are shown in green, cyan, magenta, orange, blue and brown ribbon representation, respectively. Other helices are shown in grey ribbons. Residues with normalized number of contacts larger than 0.6 are highlighted in orange space filled representation. Residues 202–204, 322, 326, 375 (not shown) are highlighted in B1 representation and residues 251–252, 264, 267, 321–322 are highlighted in B2 representation. Head-group beads of POPC and POPG are highlighted in grey and blue space filled representation. Phosphorous atoms are shown in dark brown space filled representation.

