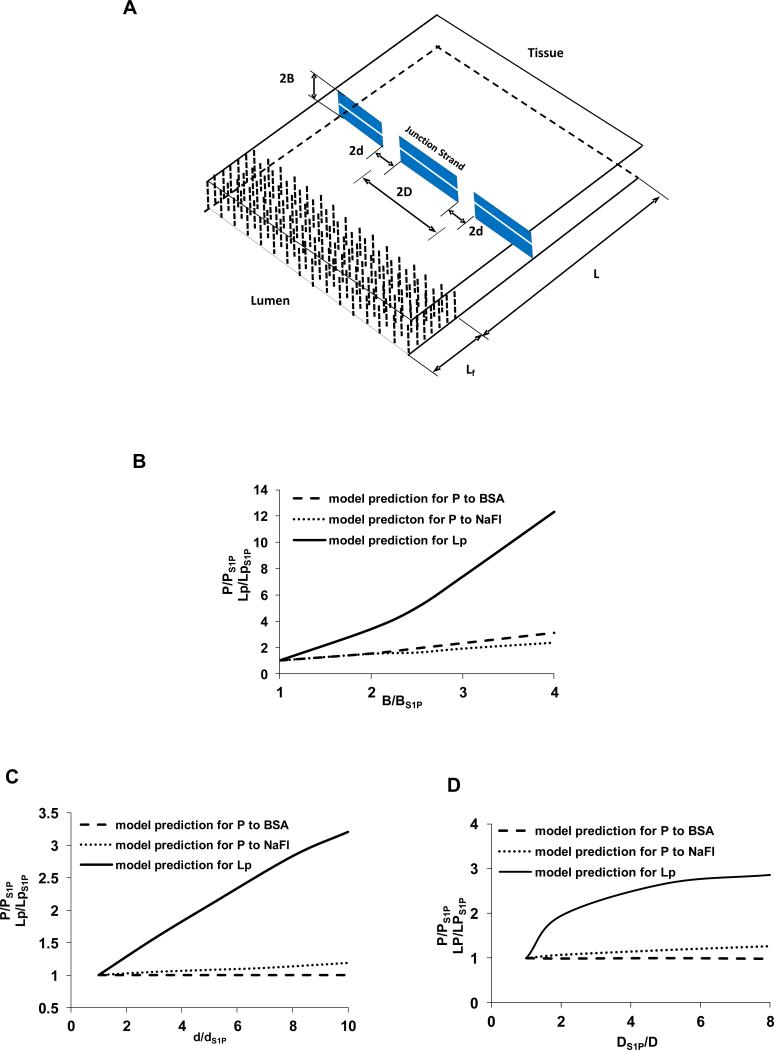
Figure 5.
(A) A three dimensional view of the model geometry for the interendothelial cleft in the wall of a rat mesenteric post-capillary venule (revised from Fu et al., 1994). A junction strand with periodic large breaks of width 2d lies parallel to the luminal front of the cleft. The distance between adjacent large break is 2D. There is a continuous small slit also in the junction strand. An endothelial surface glycocalyx layer (ESG) of thickness Lf is at the cleft entrance; L, the total depth of the cleft; and 2B, the width of the cleft. (B)-(D) model predictions for the effect of changing structural components of the interendothelial cleft on P to BSA, P to sodium fluorescein (NaFl) and hydraulic conductivity Lp. (B): increasing the cleft width 2B. (C): increasing the junction break width 2d. (D): increasing the number of junction breaks (decreasing 2D). PS1P, LpS1P, BS1P, dS1P, DS1P are control values in the presence of S1P.

