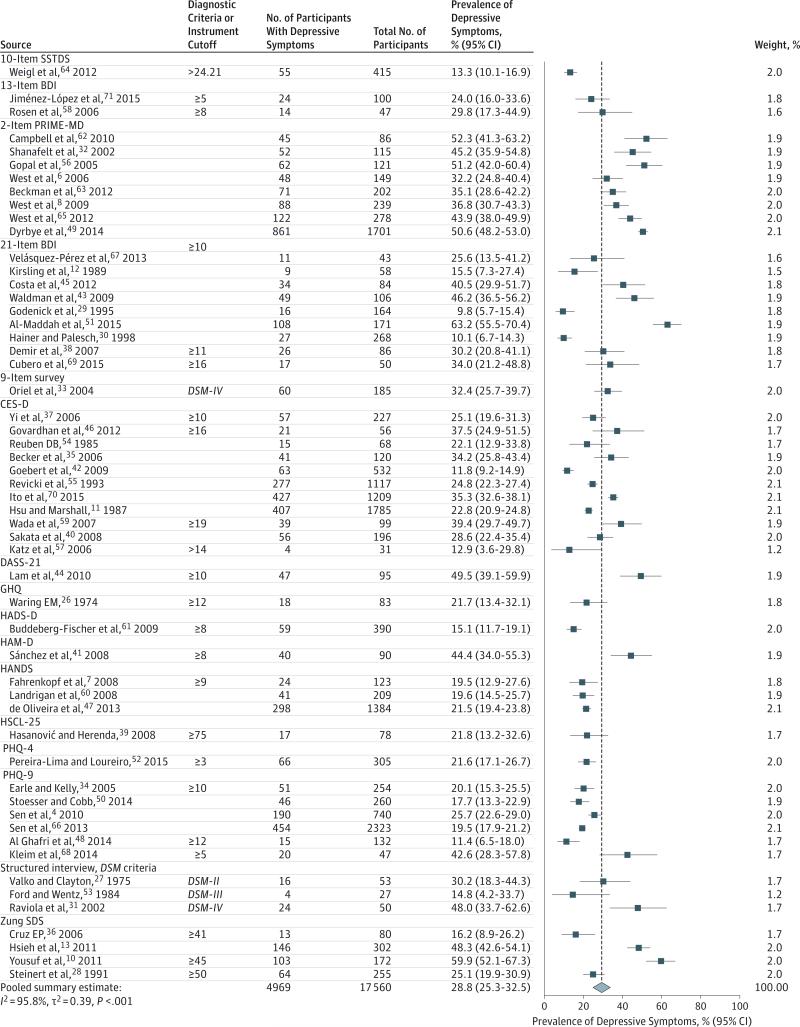
Figure 2. Meta-analysis of the Prevalence of Depression or Depressive Symptoms Among Resident Physicians.
Contributing studies are stratified by screening modality and ordered by increasing sample size. The area of each square is proportional to the inverse variance of the estimate. The dotted line marks the overall summary estimate for all studies, 28.8% (4969/17 560 individuals, 95% CI, 25.3%-32.5%, Q = 1247.11, τ2 = 0.39, I2 = 95.8% [95% CI, 95.0%-96.4%], P < .001). (Refer to footnotes of Table 1 and Table 2 for expanded names of diagnostic instruments.)

