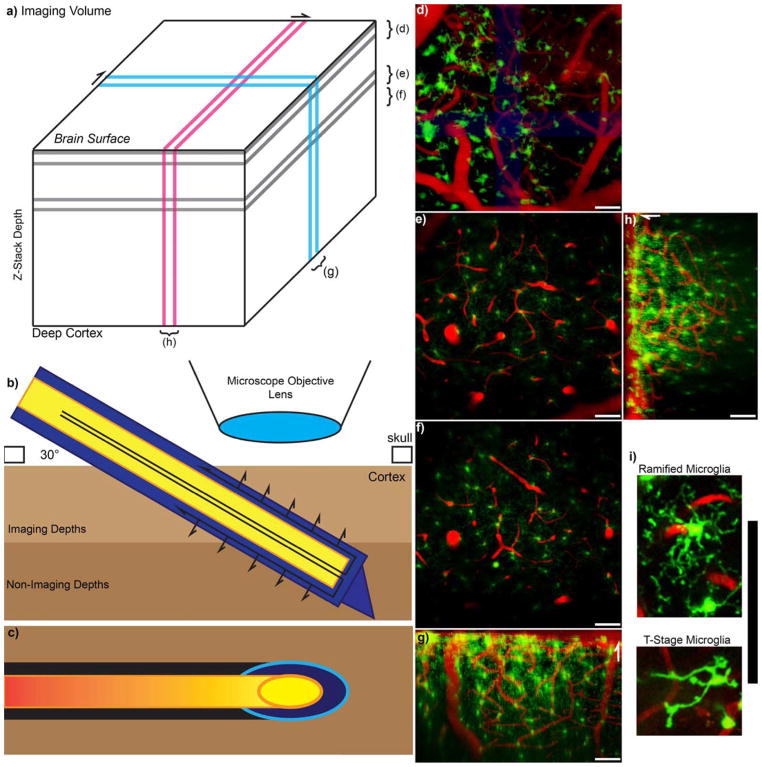
Figure 1. Experimental Setup.
a) Model Z-stack imaging volume with Two Photon Microscopy. Brackets for d–f indicate z-projections that are parallel to the skull or surface of the brain, while g and h indicate y-projection and x-projection 3D reconstruction, respectively. b) Schematic of the experimental setup. The outer membrane of the microdialysis probe is indicated in blue, while the inner fused silica tube is indicated in yellow. The probe is inserted at a 30-degree angle to prevent collision with the microscope objective. Arrows indicate direction of perfusion flow and passive diffusion of perfusate. c) Because the microdialysis probe is inserted at an angle, the footprint of the probe in each acquired xy-image is an ellipse as indicated by the cyan and orange. Black and red highlight the optic shadow created by the microdialysis probe above. d) The top 50 microns at the surface of the brain is covered with large surface macrophages. e–f) 100–150 μm and 150–200 μm Z-projections show ramified (normal) microglia with radially extended processes. (d–f) are parallel to the skull. g–h) 100 μm thick 3D reconstruction side view. White arrows point towards surface of the brain. i) Zoomed in image of a ramified (R-stage) microglia and transition stage (T-stage) microglia. All scale = 100 μm.

