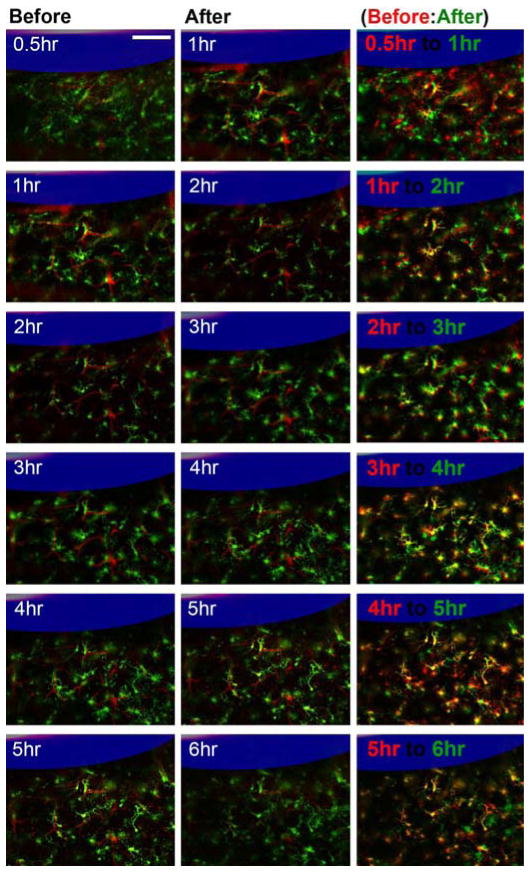
Figure 6.
Dynamic microglia reaction around aCSF perfused microdialysis from 0.5 hr to 6 hr. Microdialysis probe is outlined in blue. White numbers label static time points, red are landmark blood vessels, and green is microglia. Retraction of processes can be identified as decrease of green pixels and increase in black pixels from the first to second column. Red and green labeled panels on the right show overlap of the two time points (earlier time point in red and later time point in green: retraced processes (green), extended processes (red)). In these panels, yellow highlight common features while red and green show microglia differences between the two time points. Scale = 100 μm.

