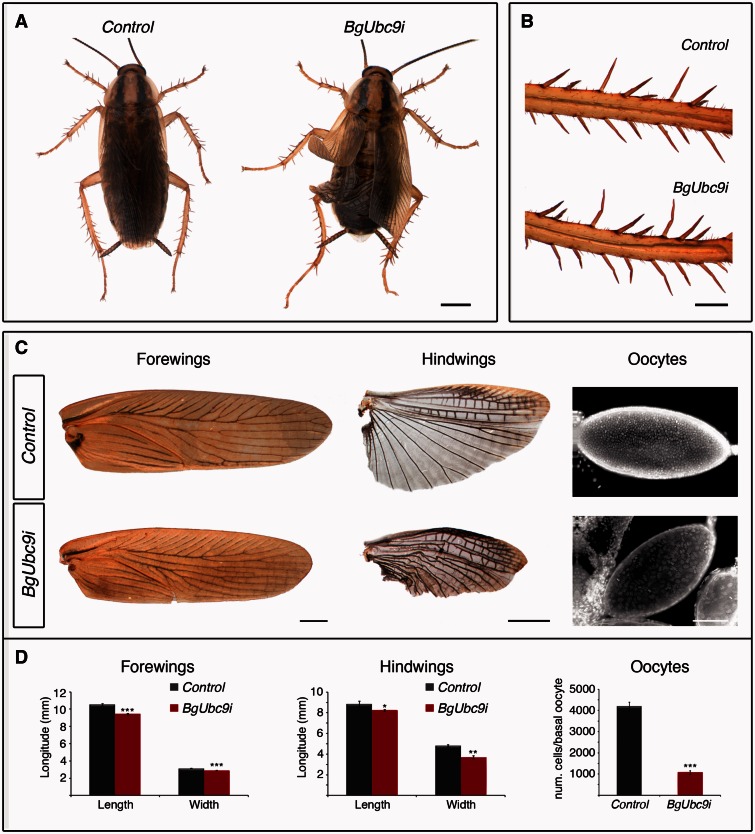
Fig. 5.
Depletion of Blattella BgUbc9 phenocopies the absence of BgSUMO1 and BgSUMO3. (A) Dorsal view of newly molted Control (left) and BgUbc9i (right) adults. Scale bar: 2 mm. (B) Details of the adult bristles in Control and BgUbc9i individuals. Scale bar: 0.5 mm. (C) Phenotypic analysis of the forewings (left column), hindwings (central column), and DAPI staining of basal oocytes (right column) of newly molted Control and BgUbc9i adults. Scale bars: 1 mm (forewings), 2 mm (hindwings), and 5 μm (oocytes). (D) Means of maximum length and width of forewings and hindwings, and follicular cell number from basal oocytes of newly molted Control and BgUbc9i adults. Error bars represent SEM (n = 5). Asterisks indicate differences statistically significant as follows: *P ≤ 0.05; **P ≤ 0.001; ***P ≤ 0.0005 (t-test).

