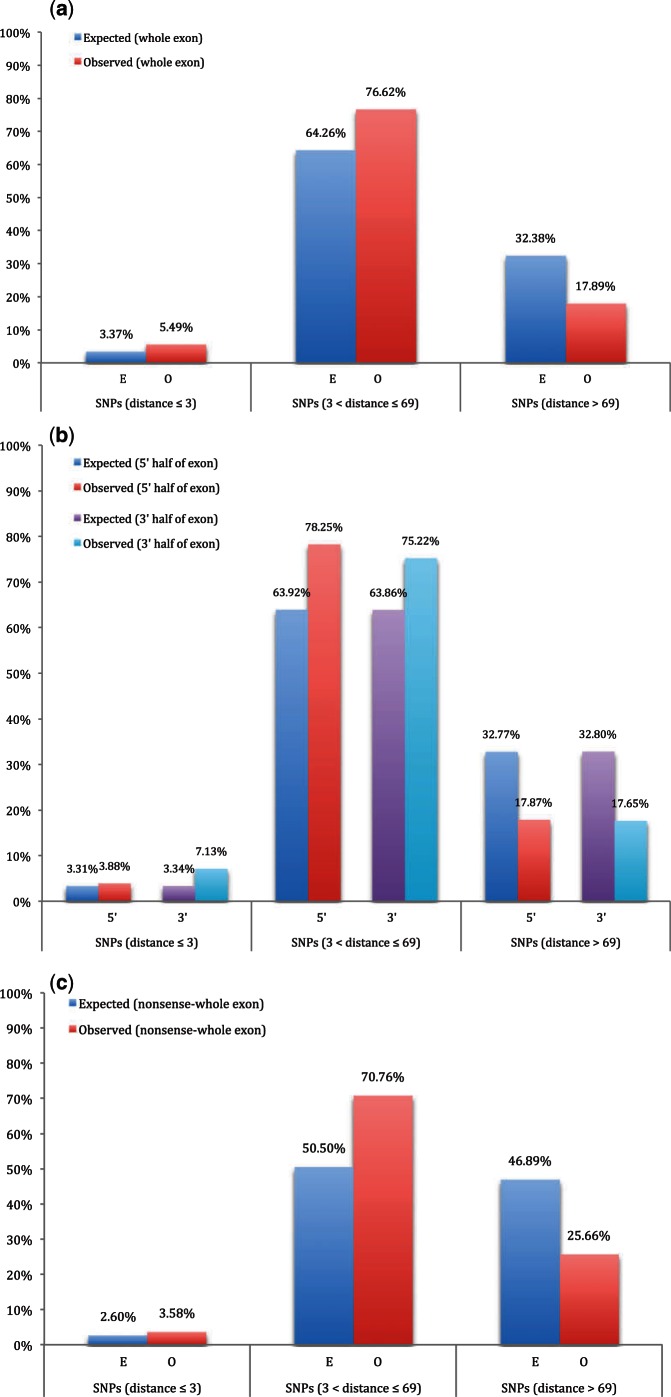
Fig. 1.
Pathogenic SNPs are enriched close to exon junctions. (a) Of 8,250 pathogenic SNPs in internal exons, the great majority (76.62%) are within 3–69 bp from the exon ends. We consider enrichment of SNPs in three domains: 1) splice sites (≤3 bp) are greatly enriched for pathogenic SNPs (Observed: 5.49%, Expected: 3.37%); 2) Pathogenic SNPs have significant preference at exon terminal domains (3–69 bp, Observed: 76.62%, Expected: 64.26%). 3) Distribution of pathogenic SNPs in exon cores are relatively underrepresented (Observed: 17.89%, Expected: 32.38%). (χ2 = 841.64, df = 2, P < 1.74 × 10−183). (b) The same pattern of significant deviation in pathogenic SNPs distribution are observed for: 1) 5′-half of internal exons (χ2 = 410.62, df = 2, P < 6.85 × 10−90); 2) 3′-half of internal exons (χ2 = 551.74, df = 2, P < 1.55 × 10−120). (c) Distribution of nonsense pathogenic SNPs in internal exons are similar to that of non-nonsense mutations (χ2 = 455.37, df = 2, P < 1.31 × 10−99).

