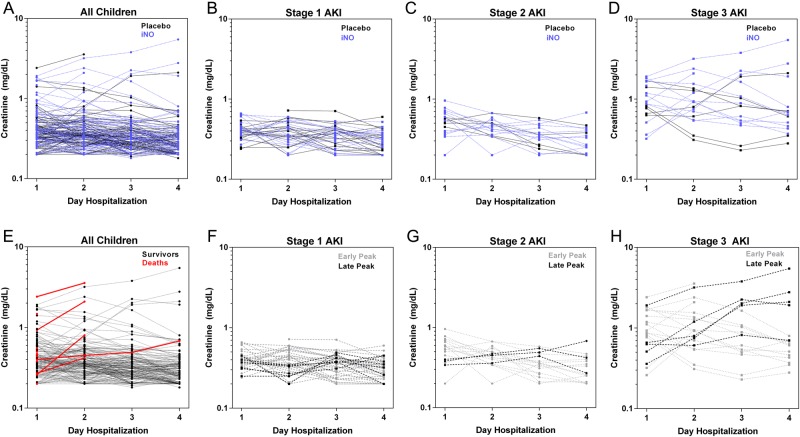
Figure 2.
Changes in creatinine over hospitalization according to outcome and stage of acute kidney injury (AKI). (A) Line graphs showing individual creatinine plots for each child according to trial arm with children randomized to placebo in black and children randomized to inhaled nitric oxide (iNO) in blue. Line graphs showing individual creatinine plots for children with AKI according to stage [(B) stage 1 AKI; (C) stage 2 AKI; (D) stage 3 AKI] and trial arm. (E) Line graphs showing individual creatinine plots for each child according to outcome with survivors shown in black and in-hospital deaths shown in red. (B–D) Line graphs showing individual creatinine plots for children with AKI according to stage [(F) stage 1 AKI; (G) stage 2 AKI; (H) stage 3 AKI] and the timing of creatinine peak, with early indicating the peak creatinine recorded on day 1 or 2 of hospitalization, and late indicating the peak creatinine recorded on day 3 or 4 of hospitalization.

