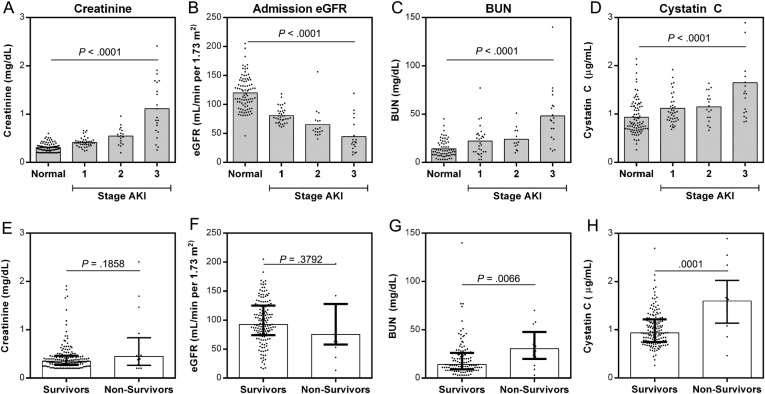
Figure 3.
Biomarkers of renal function measured at admission across stages of acute kidney injury (AKI) and their association with acute mortality. (A–D) Scatter plots showing the median and distribution of renal biomarkers at admission in children with no AKI (normal), and AKI stratified by stage. The relationship between biomarkers and AKI was evaluated using a test for trend (Jonckheere-Terpstra Test for Ordered Alternatives). (E–H) Scatter plots showing the median, interquartile range, and distribution of renal biomarkers in survivors (n = 162) vs nonsurvivors (n = 16). Analysis was performed by Mann–Whitney U test. Abbreviations: BUN, blood urea nitrogen; eGFR, estimated GFR.

