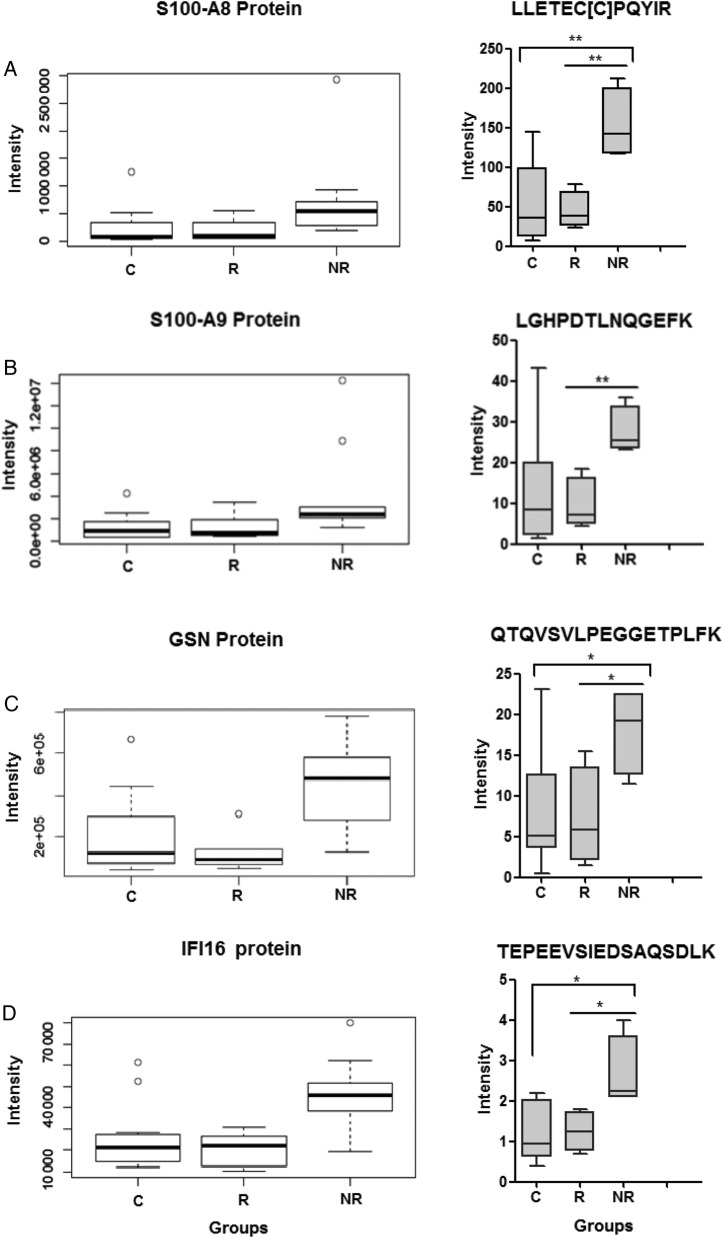
Figure 4.
Validation of target proteins. Five target proteins were selected for validation via selected reaction monitoring (SRM)-targeted proteomic technique. For each protein, a target peptide was selected, including the following: (A) S100A8 (LLETEC[C]PQYIR), (B) S100A9 (LGHPDTLNQGEFK), (C) GSN (QTQVSVLPEGGETPLFK), and (D) IFI16 (TEPEEVSIEDSAQSDLK). The left panel highlights the peptide intensity-based quantification via label-free analysis for the 5 selected proteins across groups (nonresponder [NR] = 9, responder [R] = 8, and control [C] = 11). Statistical analysis on the normalized data was performed using analysis of variance (ANOVA) model (P ≤ .05) and was visualized using boxplots. The right panel illustrates box-and-whisker plots of the abundance of each peptide via targeted SRM analysis. Statistical analysis on the SRM data was performed using one-way ANOVA, and it is represented by red box for NRs (n = 4), blue box for R (n = 4), and green box for C (n = 8) subjects. *P ≤ .05 and **P ≤ .01 by 2-tailed Student's t test.

