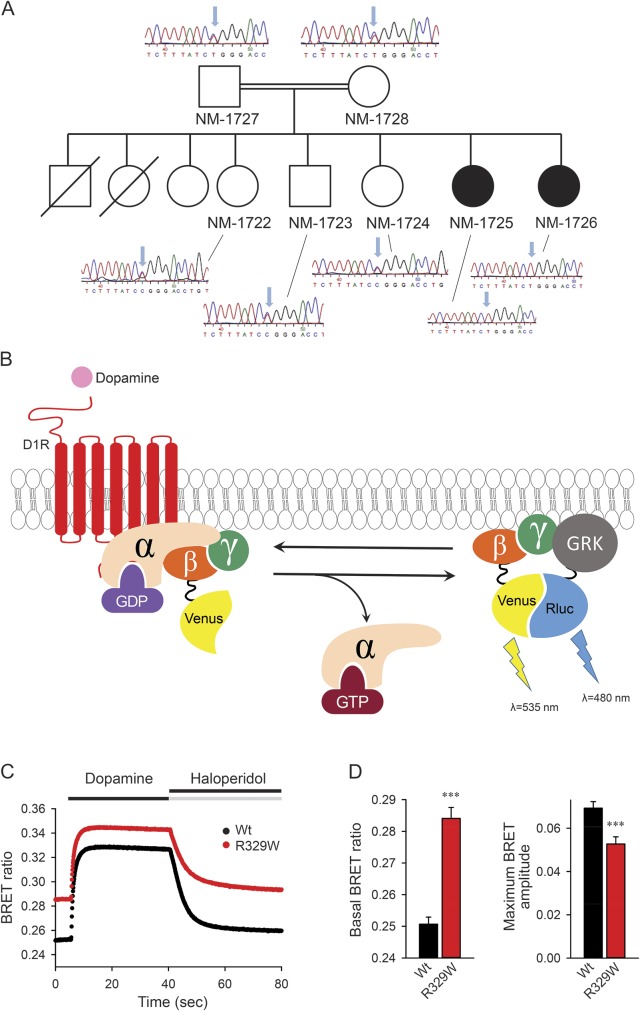
Figure. GNAL mutation and functional characterization.
(A) Family pedigrees. Filled symbols correspond to affected individuals. Empty symbols represent healthy individuals. Electropherograms show the missense mutation that leads to the (p.R293W) variant of GNAL. (B). Schematic of Gαolf functional coupling to D1R and bioluminescence resonance energy transfer (BRET) assay. Stimulation of the D1R by dopamine results in the dissociation of Gαolf from the heterotrimer. Released Gβγ subunits tagged with Venus become available for interaction with Nluc-tagged GRK reporter producing the BRET signal, which is determined by the change in the emission ratio at wavelengths 535 and 480 nm. (C) Time course. BRET signal changes upon stimulation of cells with dopamine and subsequent deactivation by haloperidol. (D) BRET ratios. Basal ratios calculated before the application of dopamine reflect the extent of the Gαolf–Gβγ heterotrimer formation, and changes in the BRET ratio from basal signal to maximal response reflect the amplitude of the response. Results represent the mean of quadruplicate wells from a typical experiment. Similar results were seen in 2 independent experiments. Error bars represent the SEM. An unpaired t test was performed to determine statistically significant differences. Asterisks indicate statistical significance from wild-type control: ***p < 0.001.

