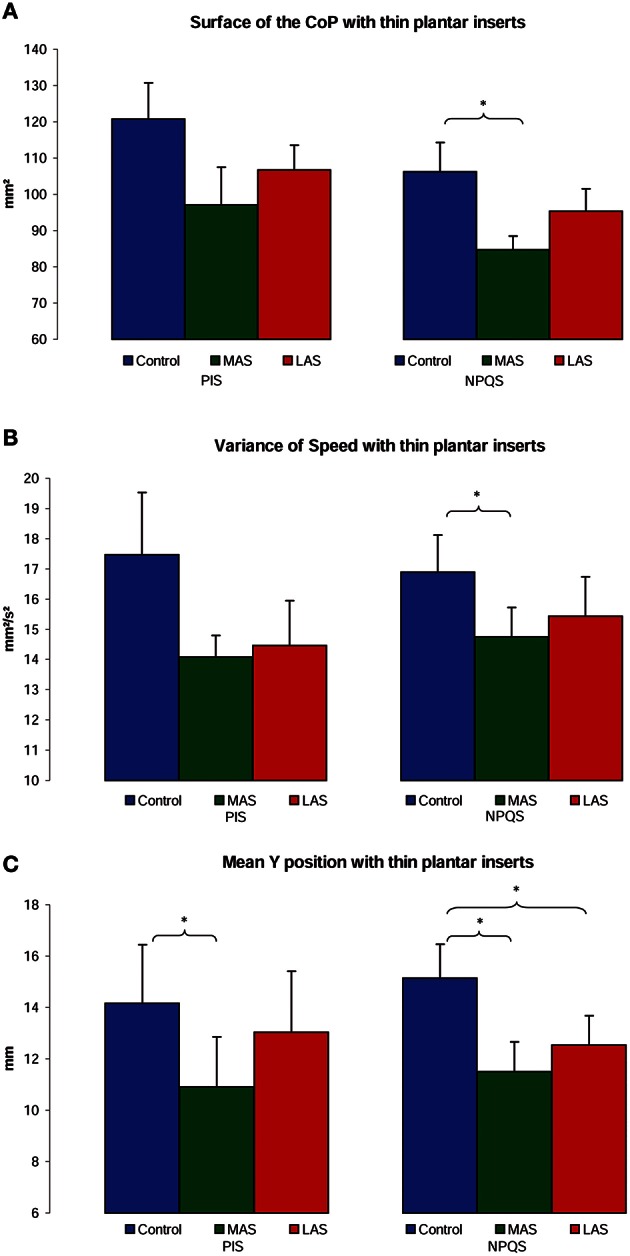
Figure 3.

Postural performances among PIS and NPQS. Mean of the Surface area (A), Variance of Speed (B), and Y position (C) of the Center of Pressure excursions for each testing condition. Error bars represent the standard error. Asterisks indicate significant differences, with *p < 0.05.
