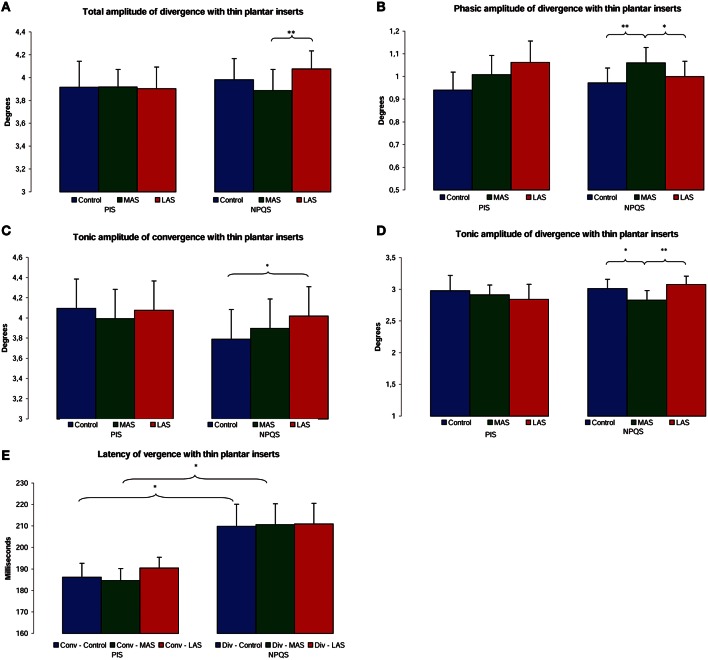
Figure 4.
Oculomotor performances among PIS and NPQS. Mean of the total amplitude of divergence (A), phasic amplitude of divergence (B), tonic amplitude of convergence (C), and divergence (D), and latency of convergence and divergence (E) for each testing condition. Error bars represent the standard error. Asterisks indicate significant differences, with *p < 0.05; **p < 0.01.

