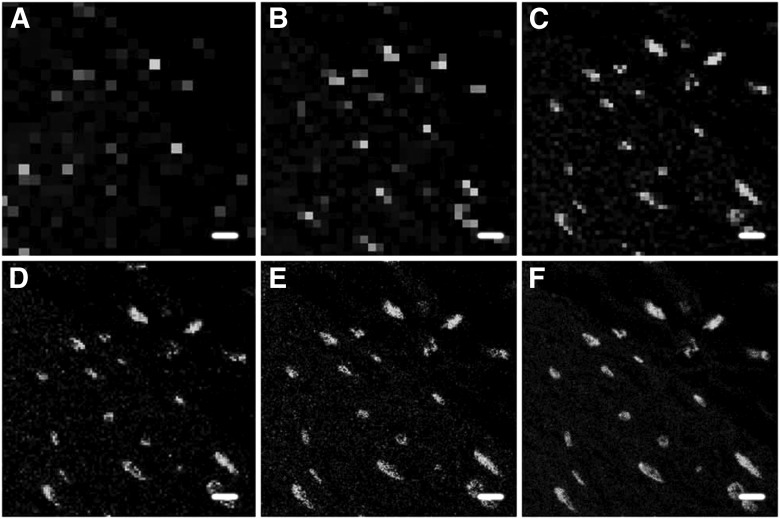
Figure 1.
Sampling density affects the appearance of the final image. Images represent a typical field of view, showing several nerve termini identified by the localization of tyrosine hydroxylase. All images were acquired with a 20×/0.7 NA objective lens using different sampling rates. Pixel length for each panel: A) 6 µm; B) 3 µm; C) 1.5 µm; D) 0.75 µm; E) 0.37 µm; F) 0.09 µm. Original scale bars, 6 µm.

