
Fig. 2.
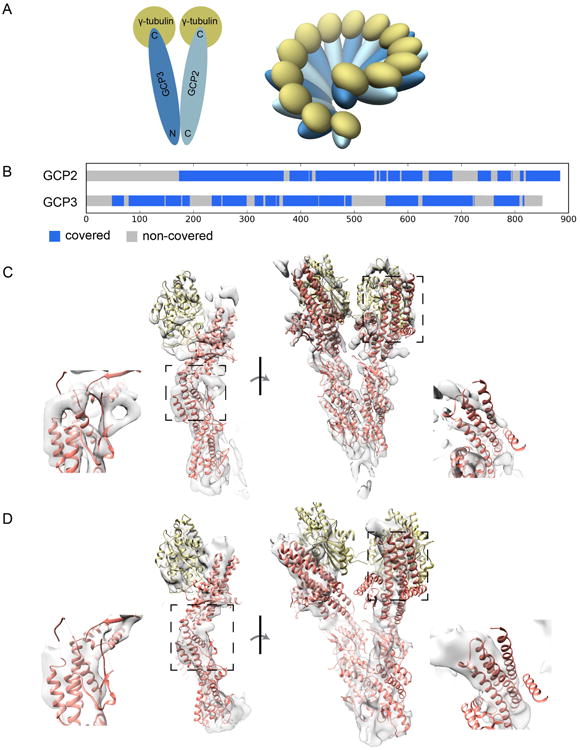
Data overview. (A) Architecture of γ-TuSC. Left, single γ-TuSC V structure with sequence endpoints. These colors are used in all figures. Right, ring structure. (B) Coverage map. Blue regions have structure coverage from the homologue GCP4. (C) Rigid fit of templates into closed cryo-EM density map. Details indicate regions of significant difference between the model and the map. (D) Rigid fit of templates into open cryo-EM density map.