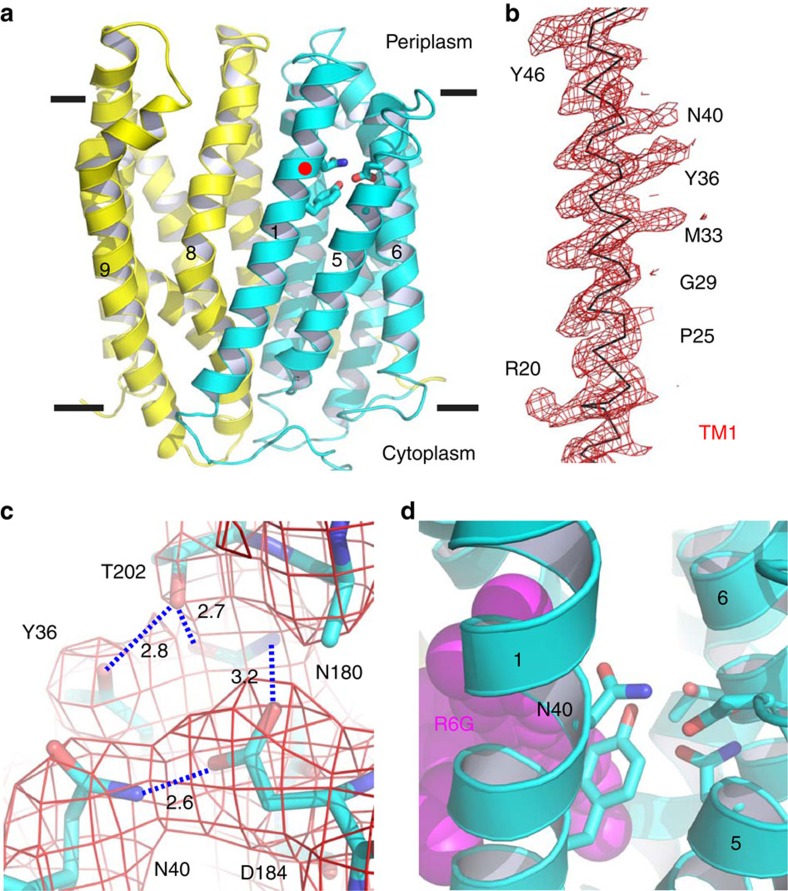
Figure 1. Structure of DinF-BHD40N.
(a) Structure of DinF-BHD40N as viewed parallel to the membrane. The N (residues 3–227) and C (residues 228–448) domains are coloured cyan and yellow, respectively. Relevant transmembrane helices are numbered and amino acids are drawn as sticks. Red dot highlights N40. (b) Experimental electron density for TM1. The map (red mesh) was calculated to 3.0 Å resolution and contoured at 1.5 σ, using density-modified MIRAS phases. Relevant amino-acid side chains are numbered. (c) Experimental electron density for the H-bond network. The map (red wire) was calculated to 3.0 Å resolution and contoured at 1.5 σ, using density-modified MIRAS phases. Relevant amino-acid side chains are drawn as sticks. H-bonds are indicated by dashed lines and the distances (in angstroms) are indicated. (d) Close-up view of amino acids (sticks) that form the H-bond network, with N40 numbered. The substrate-binding site is indicated by R6G (magenta spheres), which was taken from the R6G-bound structure9.

