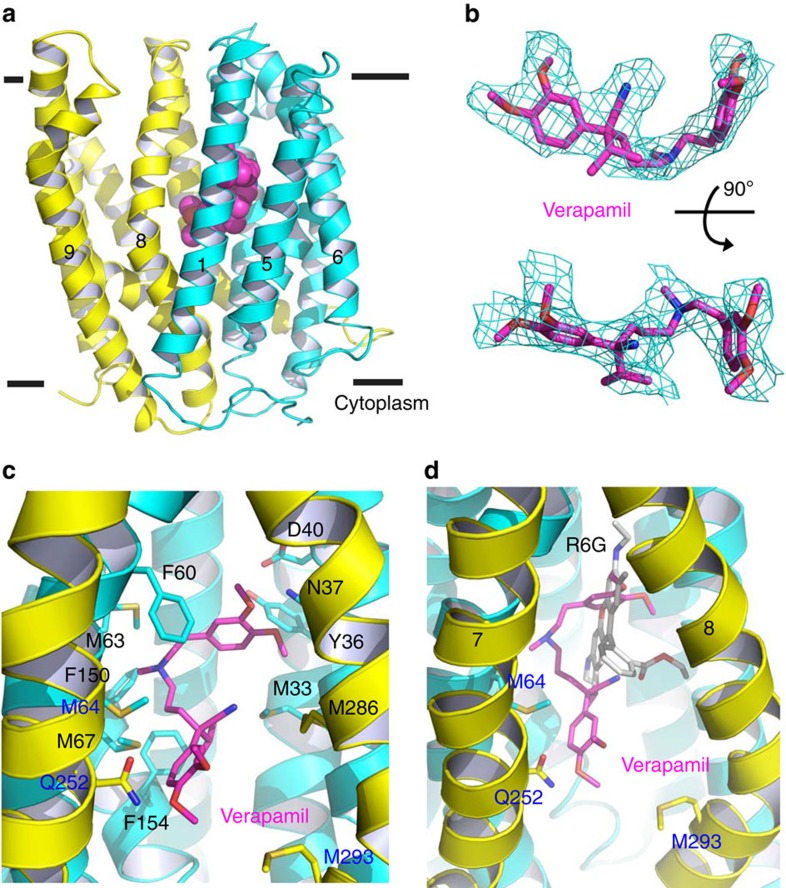
Figure 3. Structure of verapamil-bound DinF-BH.
(a) DinF-BH is shown in ribbon rendition and coloured as in Fig. 1a, whereas the bound verapamil is drawn as magenta spheres. (b) Fitting of the asymmetric verapamil to the experimental electron density map (cyan mesh), which was calculated to 3.0 Å resolution using density-modified MIRAS phases and contoured at 1.5 σ. The map was overlaid onto the final model of verapamil (magenta sticks). Top view is related to the bottom one by a rotation of 90°. (c) Close-up view of the verapamil-binding site, verapamil (magenta) and relevant amino acids are displayed as stick models. (d) Comparison of verapamil- and R6G-binding sites, with verapamil (magenta), R6G (grey) and amino acids that only bind to verapamil drawn as stick models.

