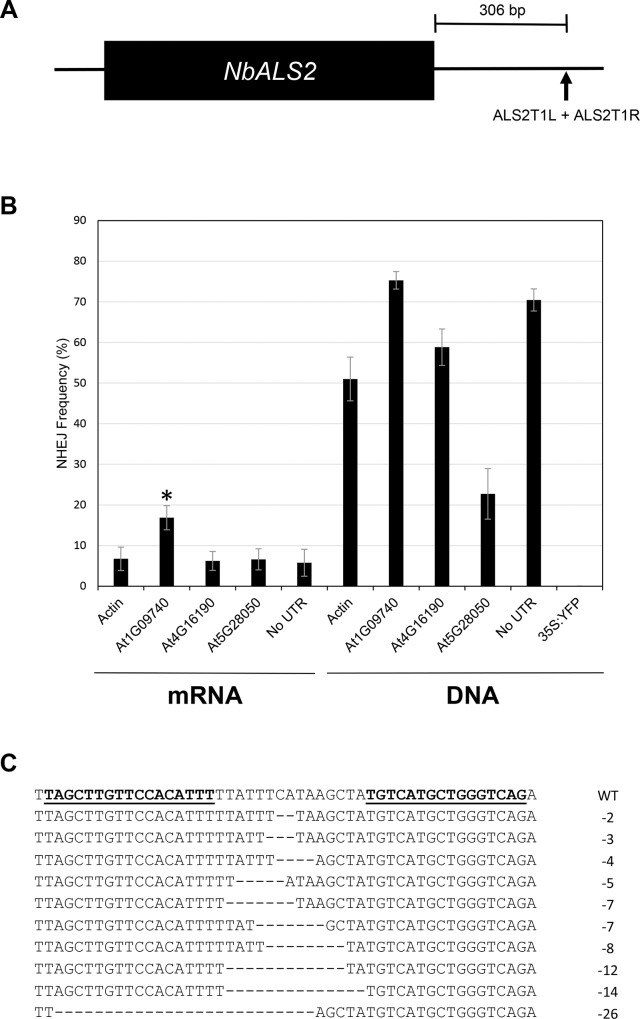
Fig 3. TALEN activity in N. benthamiana protoplasts.
A) Schematic of ALS2, indicating the TALEN target site (black triangle). The target site is 306 bp downstream of the stop codon. B) Bar graph depicting the frequency (%) of NHEJ-induced mutations created by the ALS2T1 TALEN with the four different UTRs as well as the no-UTR control. Data for both mRNA and DNA constructs are presented. The asterisk denotes a sample that is significantly different from the no-UTR control (p = 0.0065). Error bars denote standard error. C) Representative NHEJ-induced mutations. In the wild-type (WT) sequence, the TALEN binding site is indicated as underlined, bold text. Representative mutations have the number of deleted bases indicated at the right.

