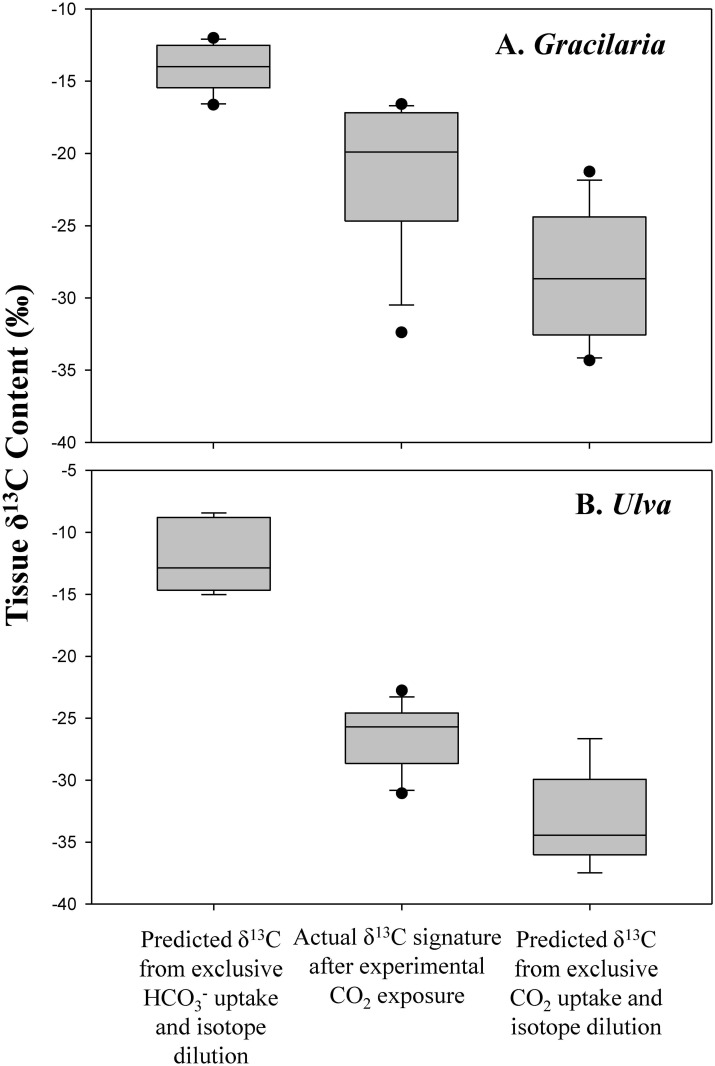
Fig 4. δ13C mixing model.
δ13C content of A) Gracilaria and B) Ulva exposed to elevated CO2 conditions compared with the δ13C signature expected from the exclusive use of CO2 or the exclusive use of HCO3-. Box plots depict the mean median (line within the boxes), 25th and 75th percentiles (lower and upper edges of the boxes), and 10th and 90th percentiles of the data (lower and upper error bars).

