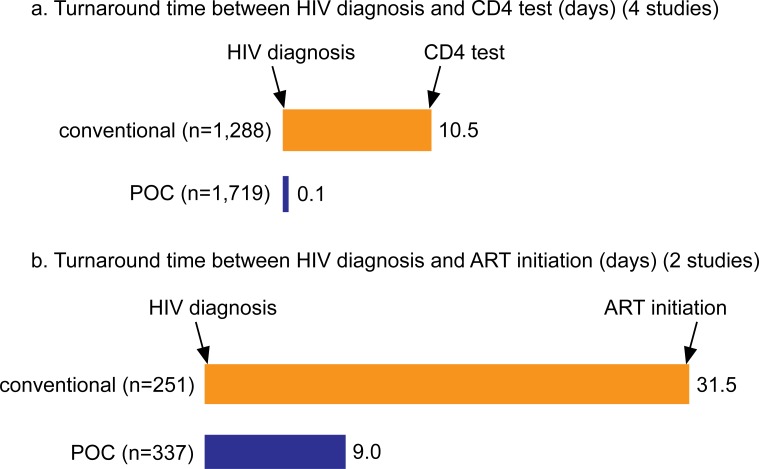
Fig 2. Mean turnaround times in days between two stages in the testing and treatment cascade.
(a) CD4 test conducted to CD4 test result received, (b) HIV diagnosis and ART initiation. Orange bars represent the mean turnaround times for conventional laboratory-based testing, while blue bars represent the mean turnaround times for POC CD4 testing.

