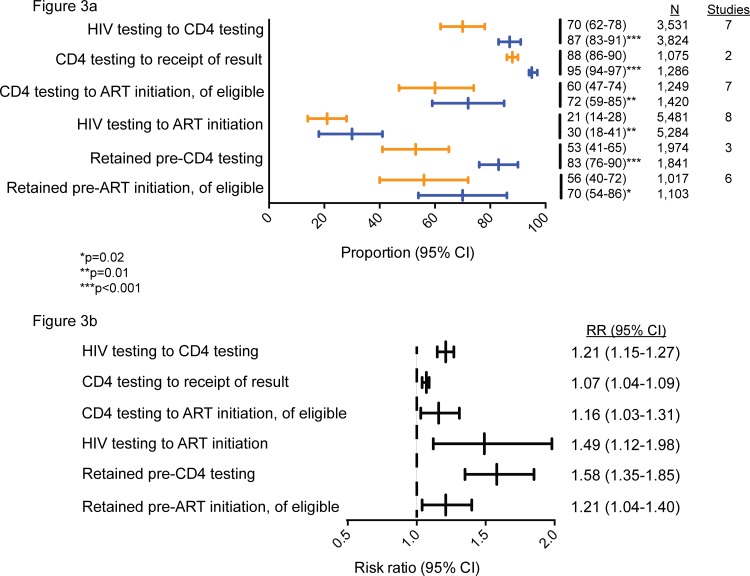
Fig 3. Proportions and risk ratios of patients reaching the next stage in the testing and treatment cascade.
(a) Proportions of patients reaching the next stage in the testing and treatment cascade. Orange dashes and bars represent the estimated proportion of retention and 95% confidence intervals of patients receiving conventional laboratory-based testing, while blue dashes and bars represent the estimated proportion of retention and 95% confidence intervals of patients receiving POC CD4 testing. (b) Risk ratios for the likelihood of retention until the next stage in the testing and treatment cascade.

