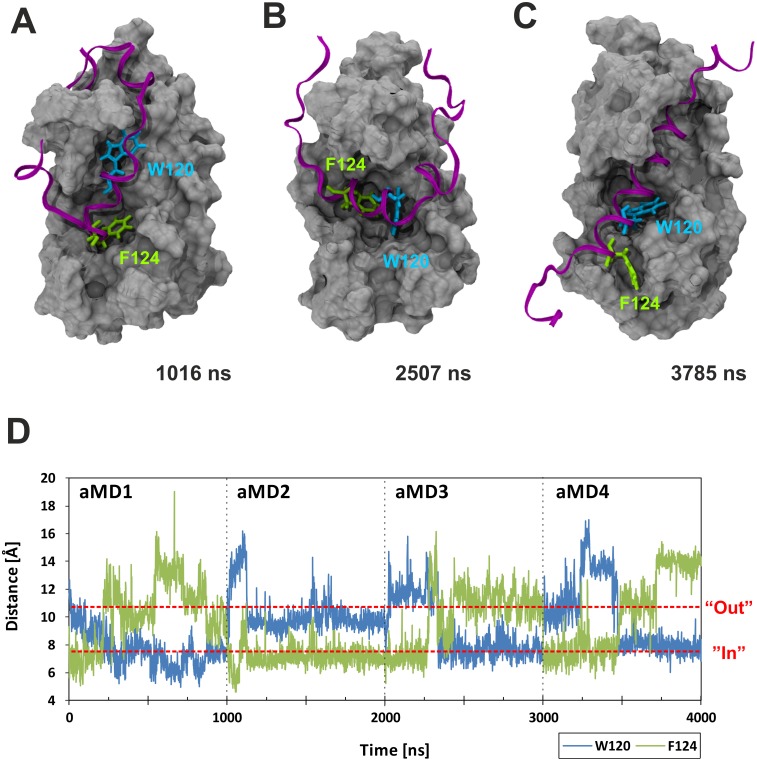
Fig 3. Differential GAL11-ABD1 pocket occupancy by GCN4-W120 and F124.
Panels A—C show the GAL11-ABD1 in grey surface representation and the GCN4-cAD as a purple ribbon. The key hydrophobic residues GCN4-W120 and F124 are shown as liquorice models in light blue and green, respectively. The time-frame shown in the right corner of each panel corresponds to the 4 x 1000 ns aggregate trajectory shown in Panel D. A. GCN4-F124 located in the ABD1 pocket near the beginning of aMD_no2. B. Co-occupancy of GCN4-W120 and F124 inside the ABD1 pocket. Note that the cAD α-helix is additionally rotated by 90° in comparison to (A) and (C). C. GCN4-W120 located within the ABD1 pocket towards the end of aMD_no4. Note that this simulation, just like the other three started out with GCN4-F124 in the pocket. D. Distance measurement [Å] between residue GAL11-A216, which forms the floor of the ABD1 pocket, and GCN4-W120 (blue trace) or F124 (green trace). For this analysis the four aMD simulations trajectories were concatenated to a single trajectory before processing to allow cross-comparison of the data under identical conditions.

