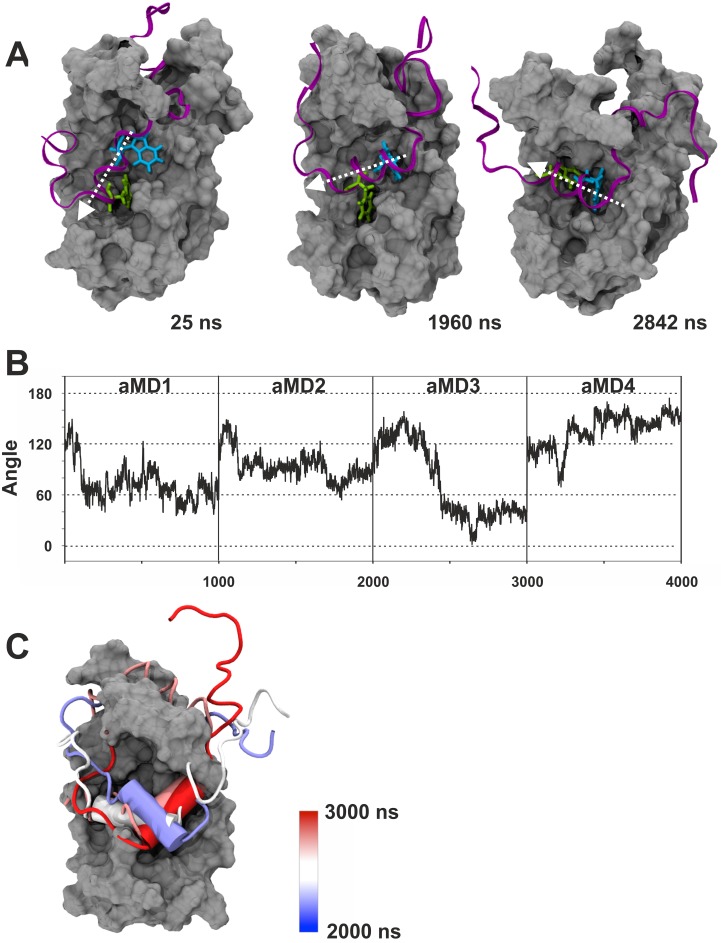
Fig 4. Changes in helical orientation of the GCN4-cAD relative to GAL11-ABD1.
A. The three panels show the GAL11-ABD1 in silver surface representation and the GCN4-cAD as a purple ribbon. The key hydrophobic residues GCN4-W120 and F124 are shown as liquorice models in light blue and green, respectively. The time-frame shown in the right corner of each panel corresponds to the 4 x 1000 ns aggregate trajectory shown in Panel D. All representations are aligned to the long α-helix 4 of ABD1 (see Fig 2B for annotation of helices; residues GAL11-Q211 and L232 were chosen as vector endpoints for α-helix 4). The helical axis of GCN4 is marked by a white arrow. B. Measurements of the angle of α-helix 4 of ABD1 in relation to the GCN4-cAD α-helix during simulations GAL11-ABD1/GCN4-cAD _aMD_no1, no 2, no3 and no4. For the cAD α-helix, residues GCN4-S117 and F124 were selected. C. Time-dependent representation of the 90° rotation performed by cAD (cartoon representation, red to blue) in GAL11-ABD1/GCN4-cAD _aMD_no3. The different helical orientations (shown in cartoon representation) at different time points throughout the one microsecond simulation are superimposed on each other. The color of the helix indicates the time point according to the color gradient scale shown on the right. The GCN4 helix undergoes a number of different orientations (~100°, ~150°, ~50° and ~0° according to the criteria defined in B).

