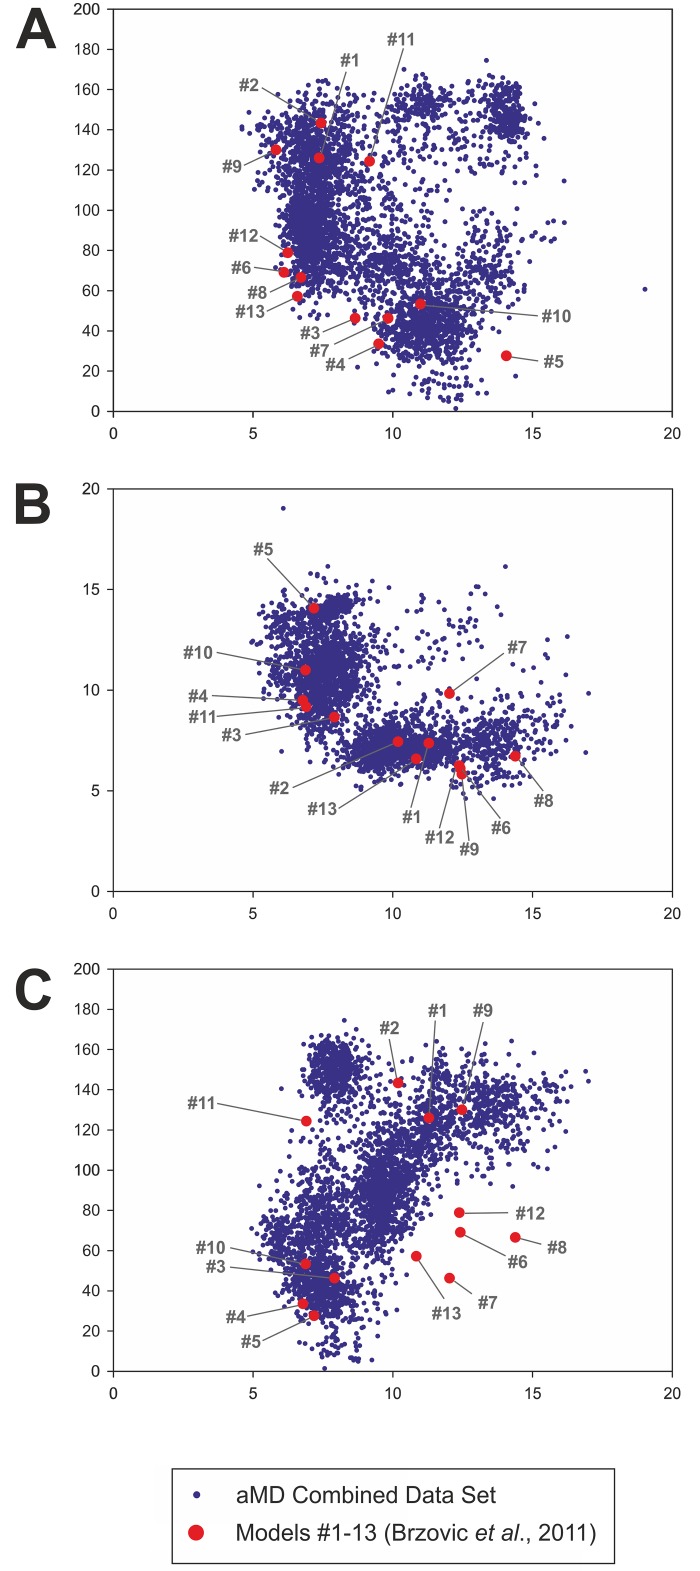
Fig 5. Distribution of the 13 experimentally-based models within aMD simulation phase space.
Each of the blue dots defines the position in phase space of a snapshot from the four combined aMDs (GCN4-cAD/GAL11-ABD1_aMD_no 1 to 4) sampled at 1 ns intervals. The red dots define the coordinates of the 13 models calculated using identical parameters (the numbers in grey identify the model numbers as used in PDB#2LPB). The distances and angles were calculated according to the criteria described in the legends of Figs 3 and 4. A. Plot of the distance of F124 relative to Pocket#1 (horizontal axis; distance in Å) versus the angle of the α-helical part of GCN4-cAD relative to GAL11-Abd1 α-helix 4 (vertical axis; angle in degrees). B. Plot of the distance of W120 (horizontal axis) versus the distance of F124 relative to Pocket#1 (vertical axis; both distances in Å). C. Plot of the distance of W120 relative to Pocket#1 (horizontal axis; distance in Å) versus the angle of the α-helical part of GCN4-cAD relative to GAL11-Abd1 α-helix 4 (vertical axis; angle in degrees). There are five PDB#2LPB model structures (#6, 7, 8, 12 and 13) that are located at the periphery of the phase space simulated by the aMD simulations using this particular parameter set. These outliers are characterized by a relatively large distance of W120 from Pocket#1 (~10–15 Å) and by narrow angle (~40–80°) of the GCN4-cAD α-helical portion relative to GAL11-Abd1 α-helix 4. This set of conformations may either require more extensive sampling to be reached from 2LPB-model#1 as a starting structure, or represent conformations that are not energetically favorable under the forcefield conditions used in the simulations.

