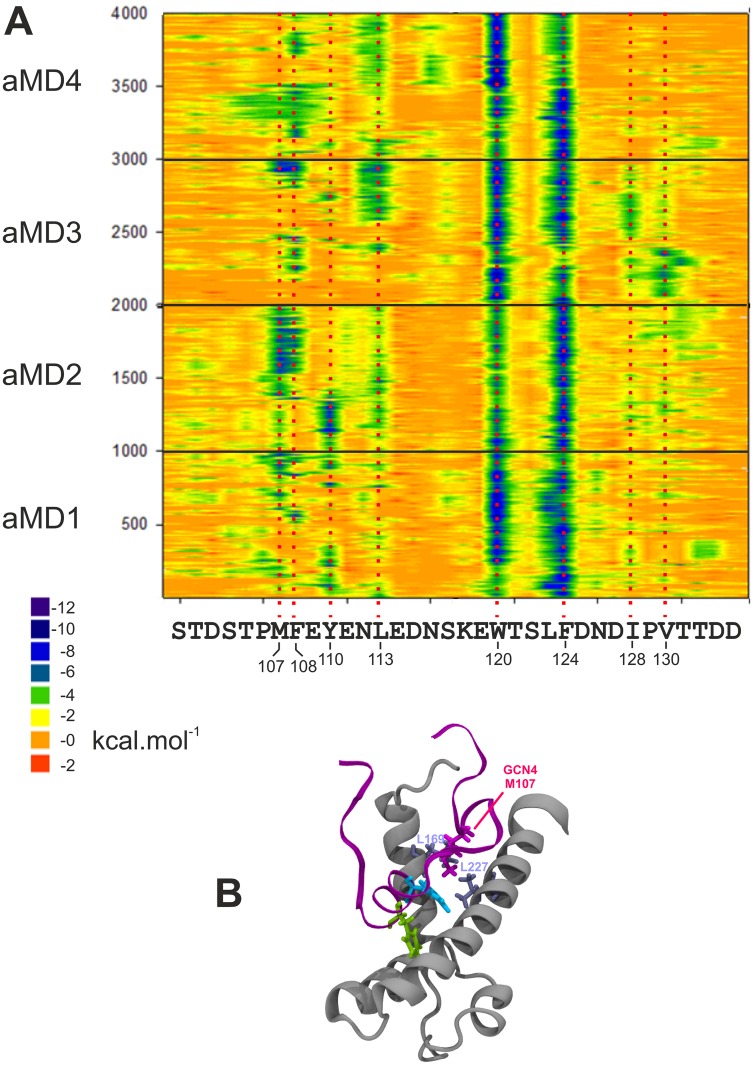
Fig 6. Molecular mechanics analysis of the GAL11-ABD1/GCN4-cAD interaction.
A. The decomposition of the van der Waals contribution is shown as a contour plot. The horizontal axis represents the amino acid sequence of the GCN4 activation that was represented in the simulations and in the models in PDB#2LPB. The vertical axis represents snapshots at 1 ns intervals from the four aMD simulations. The ΔG value of the van der Waals contribution of each residue at each time point is color-coded according to the scale shown (substantial contributions to ΔG are green and dark blue). The data derived from independent simulations (indicated on the left; aMD_no1 is represented by frames 1–1000, aMD_no2 by frames 1001–2000 etc.) are shown on the same plot to facilitate the detection of constant and variable features. Residues making significant energetic contributions are highlighted by a red-dotted line aligned to the amino acid sequence. B. Snapshot of GAL11_GCN4_aMD_no2 (frame 935) demonstrating the hydrophobic interaction between GAL4-M107 (magenta liquorice representation) with the leucine pair GAL11-L169 and L227 (light blue liquorice representation). A movie showing the dynamics of this interaction is available (S2 Movie).

