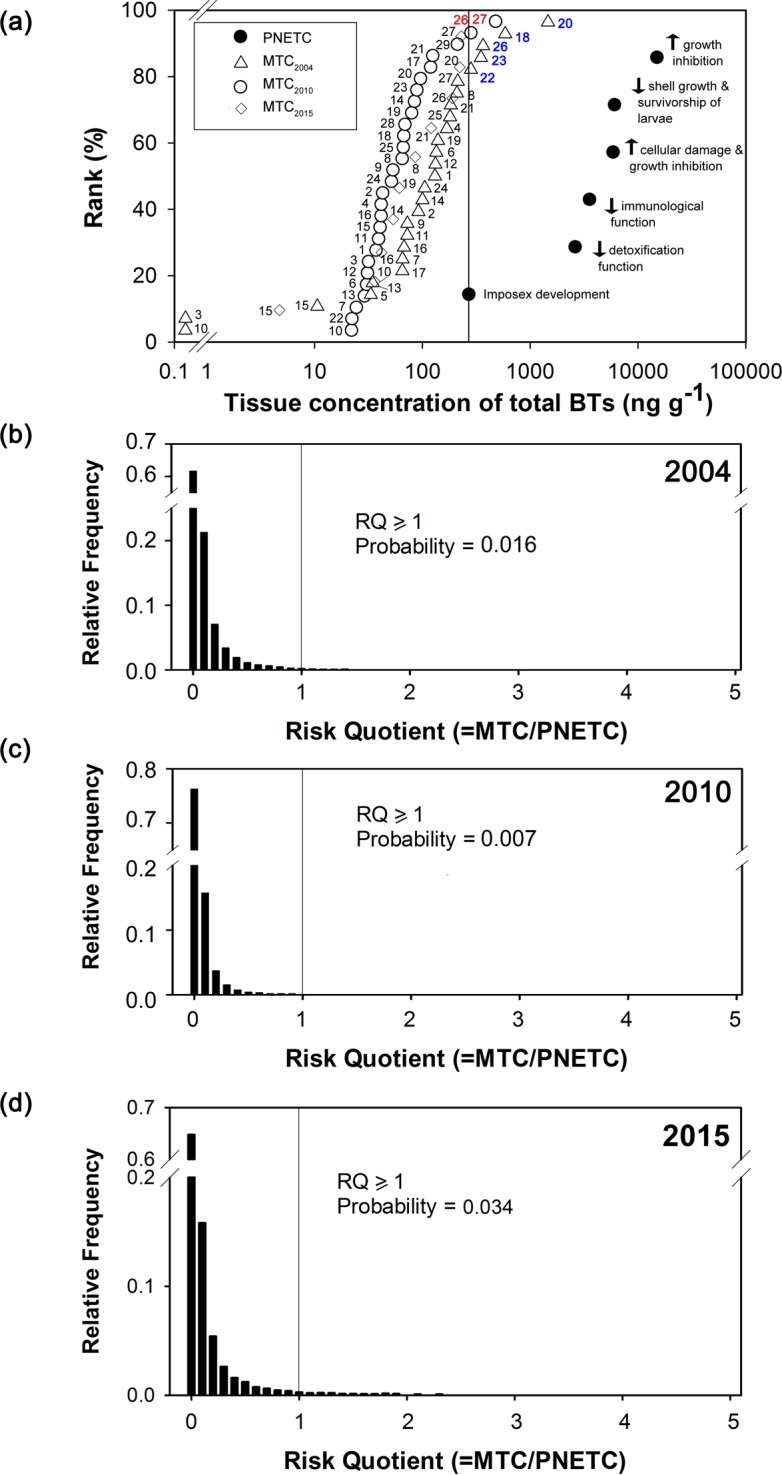
Fig 4. Results of the probabilistic ecological risk assessment.

These include (a) species sensitivity distribution to butyltins (BTs) constructed based on chronic toxicity data from literatures (PNETCs; filled circle) and distribution of tissue concentrations of total BTs in Reishia clavigera from this study (MTCs; 2010: open circle; 2015: open diamond) and from the study in 2004 (Leung et al. [14]; open triangle); (b) distribution of the computed risk quotients (RQs) of the study in 2004 (modified from Leung et al. [14]), (c) 2010 and (d) 2015 generated from Monte Carlo simulation. Site numbers (see Table 1) are labelled next to the open circles, triangles and diamonds in (a).
