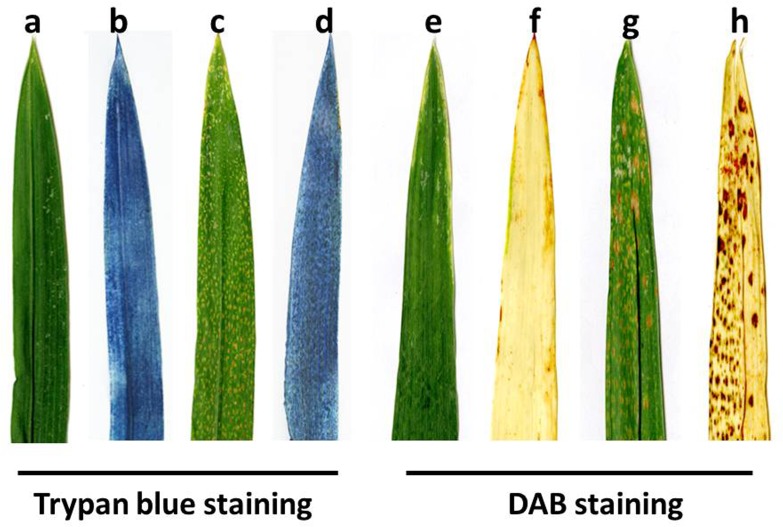
Fig 4. Histochemical analysis of wildtype and lesion-mimic plants.
a-d Trypan blue staining for cell death; e-h DAB staining for H2O2 accumulation. a, e Phenotype of the wildtype before Trypan blue and DAB staining; b, f Phenotype of the wildtype after Trypan blue and DAB staining; c, g Phenotype of the lesion mutant prior to Trypan blue and DAB staining, in which the brown spots are the lesions in the lm3 mutant; d, h Phenotype of the lesion mutant after Trypan blue and DAB staining, in which the dark blue (d) and reddish-brown spots (h) show the cell death and ROS enriched areas in the lm3 mutant, respectively. The data represent at least three experiments.

