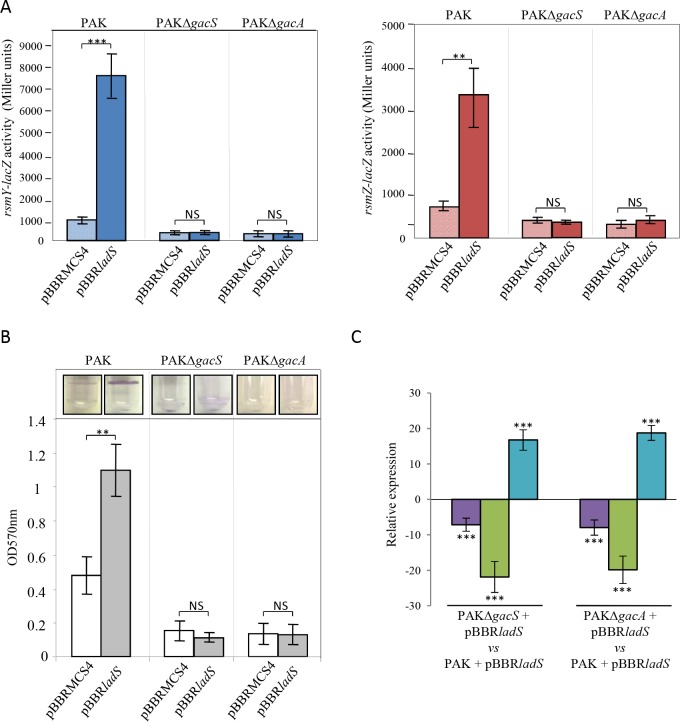
Fig 3. Role of the GacS/GacA TCS in the LadS signaling pathway.
The pBBRladS plasmid containing the ladS HK gene (dark bars) and the pBBRMCS4 corresponding empty cloning vector (light bars) were conjugated in the PAK, PAKΔgacS or PAKΔgacA strains. (A) Activities of the rsmY–lacZ (left panel, blue bars) and rsmZ–lacZ (right panel, brick-red-colored bars) transcriptional chromosomal fusions were monitored after 6 hours of growth (OD600nm≈4) and corresponding β-galactosidase activities are expressed in Miller units and correspond to mean values (with error bars) obtained from three independent experiments. (B) Biofilm production in glass tubes was illustrated (upper panel) and quantified after crystal violet-staining (lower panel). Corresponding levels of biofilm production represent mean values and standard deviations obtained from three independent experiments. Wilcoxon-Mann-Whitney tests were performed and *, **, *** and ns referred to p<0.05, p<0.01 and p<0.001 and nonsignificant difference, respectively. (C) Transcript levels of PelA (violet bars), VgrG1b (T6SS) (green bars) and ExoS (T3SS) (royal blue bars) were monitored by RT-qPCR in PAK, PAKΔgacS and PAKΔgacA strains with the pBBRladS plasmid containing the ladS HK gene and the pBBRMCS4 corresponding empty cloning vector and fold induction was presented for the two mutant strains as compared to the PAK strain. Moderated t-tests were performed; *, ** and *** referred respectively to p<0.05, p<0.01 and p<0.001.

