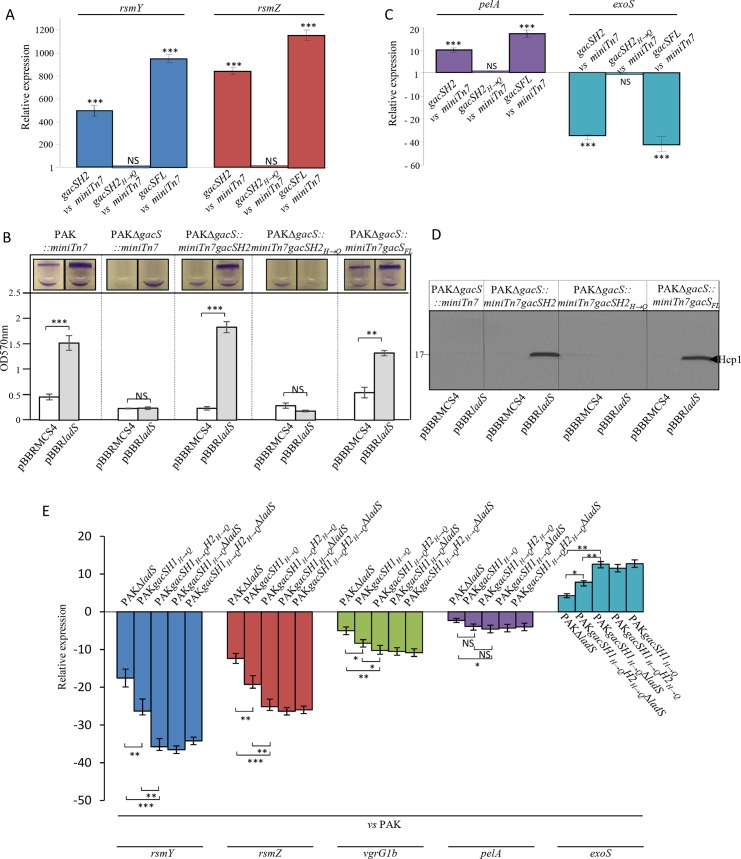
Fig 6. Involvement of the H2 domain of the GacS unorthodox HK in the LadS signaling pathway.
The pBBRladS plasmid containing the ladS HK gene and the pBBRMCS4 corresponding empty cloning vector were conjugated in the PAKΔgacS strain in which the gacSH2 or gacSH2H→Q gene versions or the corresponding suicide vector were chromosomally integrated at the Tn7 site. (A) RsmY (blue bars) and RsmZ (brick-red-colored bars) transcript levels were monitored using RT-qPCR and fold induction was presented in the strains PAKΔgacS::miniTn7gacSH2 (gacSH2) and PAKΔgacS::miniTn7gacSH2H→Q (gacSH2H→Q) as compared to the PAKΔgacS::miniTn7 strain (miniTn7). (B) Biofilm production in glass tubes was illustrated (upper panel) and quantified after crystal violet-staining (lower panel). Corresponding levels of biofilm production represent mean values and standard deviations obtained from three independent experiments. Wilcoxon-Mann-Whitney tests were performed; ** and ns referred to p<0.01 and nonsignificant difference. C. PelA (violet bars) and ExoS (royal blue bars) transcript levels were monitored using RT-qPCR and fold induction was presented in the strains PAKΔgacS::miniTn7gacSH2 (gacSH2) and PAKΔgacS::miniTn7gacSH2H→Q (gacSH2H→Q) as compared to the PAKΔgacS::miniTn7 strain (miniTn7). (D) Production of the H1-T6SS Hcp1 proteins was detected in whole cell extracts using western blot with an anti-Hcp1 polyclonal antibody. Numbers on the left side are molecular weight standards (kDa). Moderated t-tests were performed and *, **, *** and ns referred to p<0.05, p<0.01 and p<0.001 and nonsignificant difference, respectively. (E) Transcript levels of RsmY (blue bars), RsmZ (brick-red-colored bars), VgrG1 (green bars), PelA (violet bars) and ExoS (royal blue bars) were monitored using RT-qPCR. Fold induction was presented in the strains PAK, PAKΔladS, PAKgacSH1H→Q, PAKgacSH1H→QΔladS, PAKgacSH1H→QH2H→Q and PAKgacSH1H→QH2H→QΔladS in order to disable autophosphorylation of the GacSH1 domain and the functionality of the GacsH2 domain, respectively. Moderated t-tests were performed and *, **, *** and ns referred to p<0.05, p<0.01 and p<0.001 and nonsignificant difference, respectively.

