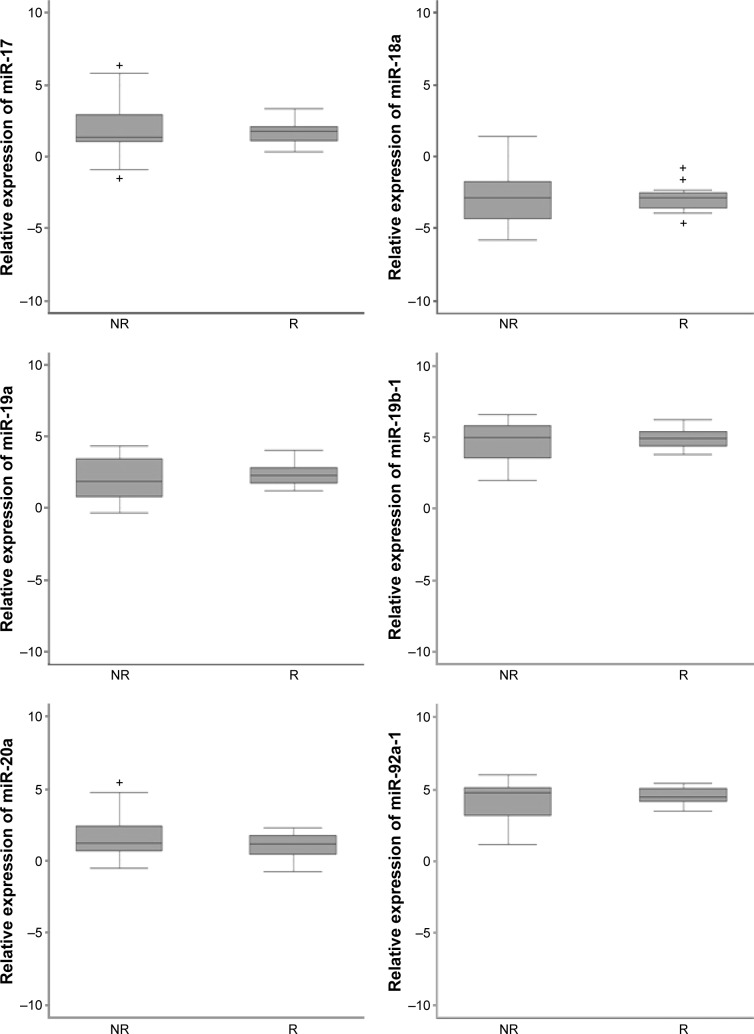
Figure 2.
Expression levels of each of the MIR17HG cluster members in different response classes. Relative expression is log2 relative expression (2−ΔCt). Box plots show median and 25th and 75th percentiles and range of expression levels. Black bars inside the box plots indicate the log2 median value of microRNA (miR)-expression levels.
Abbreviations: NR, non responders; R, responders.

