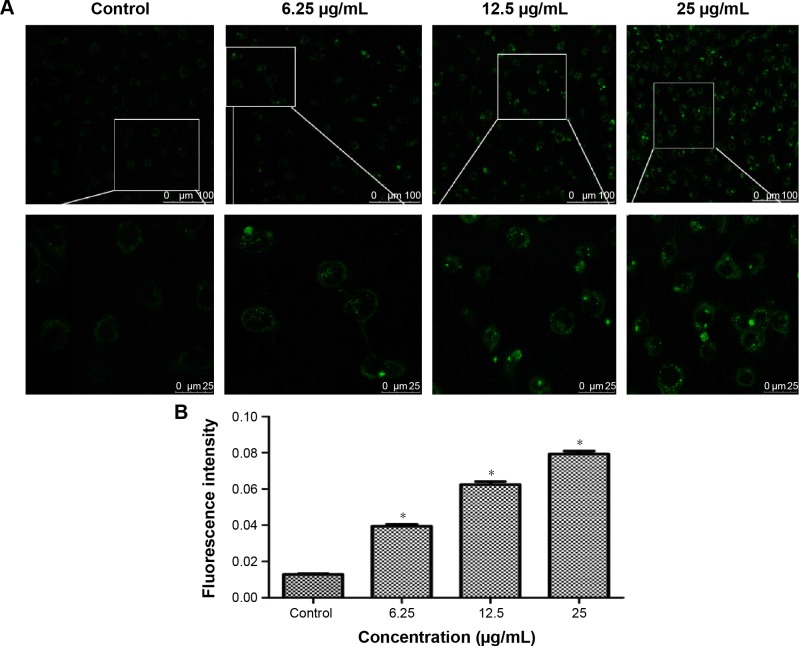
Figure 4.
The autophagy induced by TNPs.
Notes: (A) Confocal microscopy images of MDC staining showed that the fluorescence intensity was increased in a dose-dependent manner. (B) Quantification of MDC staining by fluorescent intensity analysis. *P<0.05, compared with control. Data are expressed as mean ± SD; n=3 (scale bar: 25 μm).
Abbreviations: MDC, monodansylcadaverine; SD, standard deviation; TNPs, titanium dioxide nanoparticles.

