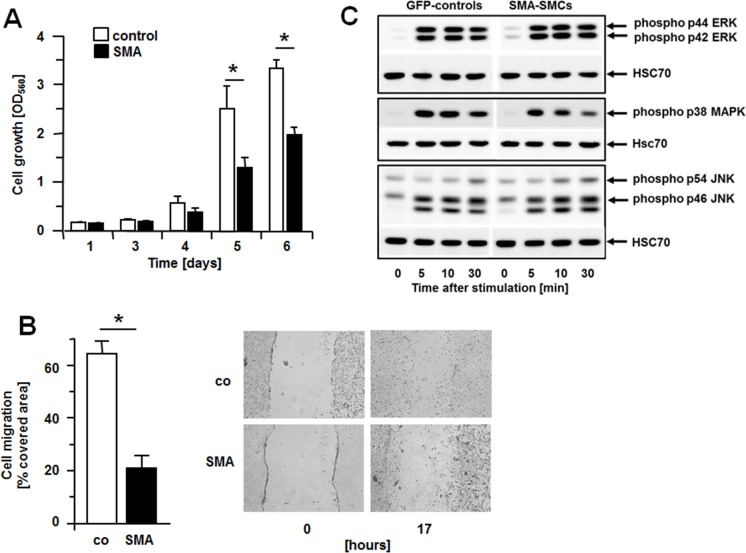
Fig 2. Expression of SMA inhibits SMC proliferation and migration but does not affect activation of MAPKs.
(A) Proliferation of GFP-controls or SMCs overexpressing SMA was determined by MTT assays at various time points after stimulation with 10% FBS. Data (OD560 measurements) are presented as mean +/- S.D. of 6 independent experiments *P< 0.001. (B) Cell migration in response to 10% FBS was measured by scratch assays. Hydroxyurea at 5 mmol/L was added to prevent proliferation. Data (percent area covered by cells 17 hours after wounding) are presented as mean +/- S.D. of 6 independent experiments. *P<0.001. Representative micrographs for GFP-controls (co) and SMA-SMCs (SMA) are shown at time 0 right after wounding and at the end of the experiment. (C) Serum-starved cells (GFP-controls and SMA-SMCs) were stimulated with 10% FBS and harvested at the time points indicated. Cell extracts were subjected to Western blot analysis and blots probed with antibodies to recognize the phosphorylated forms of p44/p42 ERK, p38 MAPK or p54/p46 JNK. In all cases, HSC70 was used as a loading control. For each phospho-antibody, a representative result from three independent experiments is shown. The band below phospho-p46 JNK is considered a singularly phosphorylated form that does not shift, or a breakdown product.

