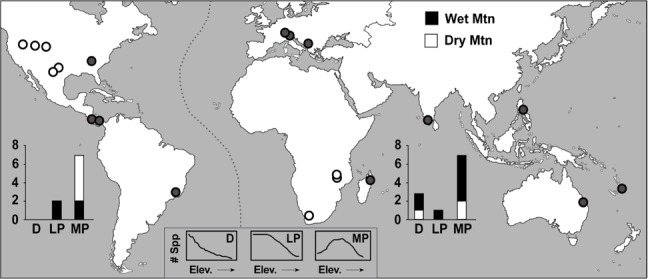
Fig 2. Map of ant elevational diversity datasets (n = 20).

The distribution of ant study sites (circles), the three main elevational richness patterns for the eastern (n = 11) and western (n = 9) hemispheres (bars), and the number of patterns on wet and dry based mountains (black & white). (D = decreasing, LP = low plateau, MP = mid-elevational peak; see embedded figures and text for definitions).
