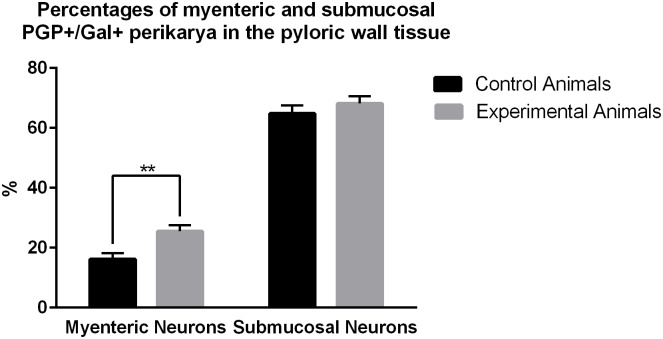
Fig 5. Percentages of myenteric and submucosal PGP+/Gal+ perikarya in the pyloric wall tissue.
Graph showing percentages of the myenteric and submucosal PGP+/Gal+ perikarya in the pyloric wall samples collected from the control and experimental animals of the subgroup H. Statistically significant differences between the control and experimental animals are marked by asterisks, ** P ≤ 0.005.

