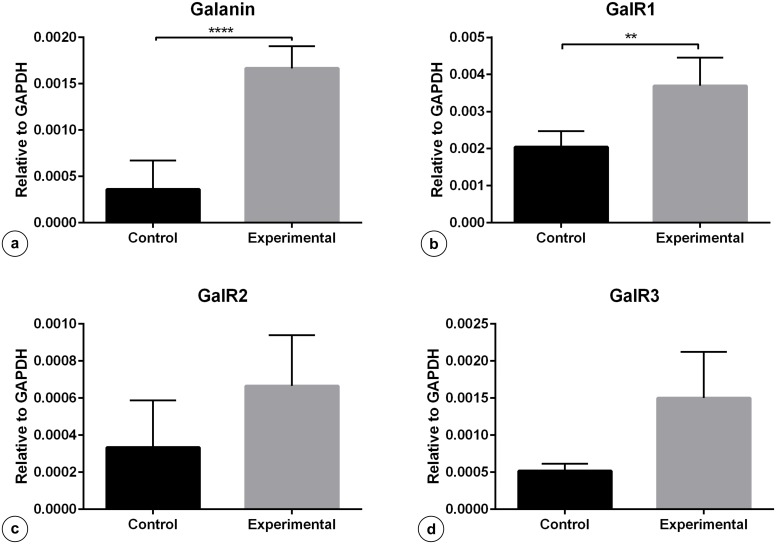
Fig 9. Expression of mRNA encoding Gal, GalR1, GalR2, GalR3 in the pyloric wall tissue.
Expression of Gal (a), GalR1 (b), GalR2 (c) and GalR3 (d) mRNA in the pyloric wall tissue collected from the control and experimental animals of subgroup M. Levels of Gal, GalR1, GalR2, GalR3 mRNA were measured by Real-Time PCR. The data obtained from each sample were normalized to GAPDH. Relative quantities (RQ) of mRNA were analysed using the comparative Ct method. Each cDNA sample was amplified in triplicate and all data are expressed as the mean ± S.E.M., **** P ≤ 0.0001; ** P ≤ 0.005 (vs the control animals).

