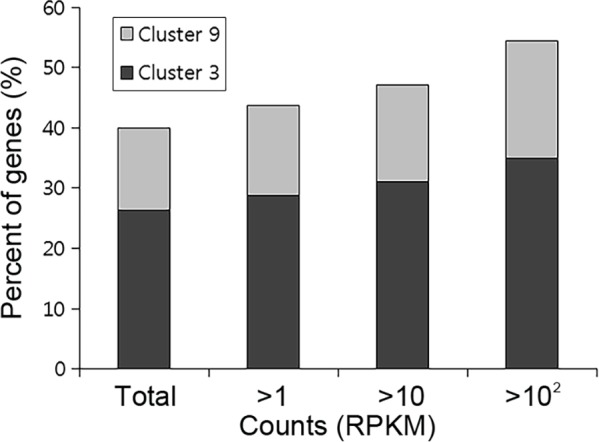
Fig 4. Percentages of genes included in clusters 3 and 9 based on their expression levels.

Genes with more than 1, 10, and 100 RPKM values 1 d after sexual induction were selected for the analysis.

Genes with more than 1, 10, and 100 RPKM values 1 d after sexual induction were selected for the analysis.