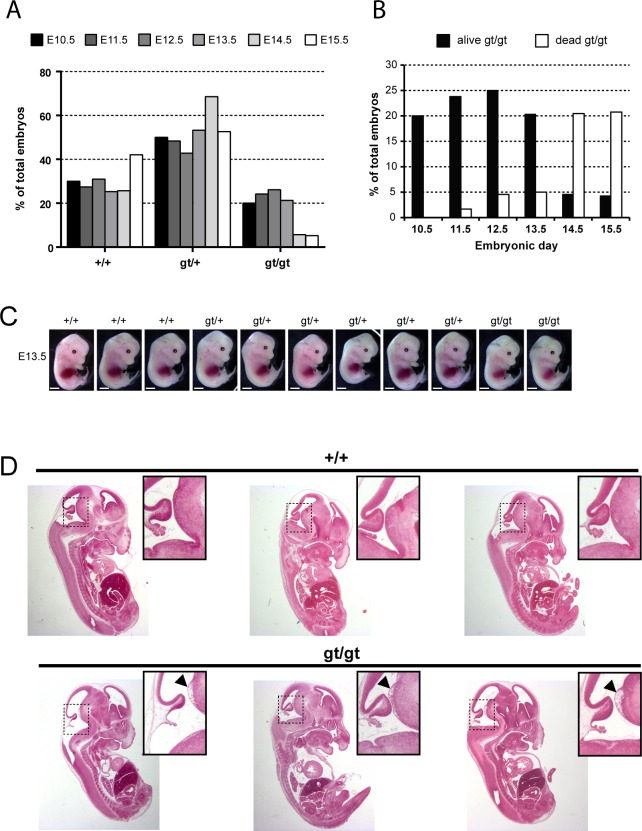
Fig 4. MPC1 gene disruption results in embryonic lethality.
(A) Genotypes frequencies of embryos derived from heterozygous MPC1gt/+ timed breeding (from E10.5 to E15.5). (B) Proportion of live and dead MPC1gt/gt embryos (relative to total embryos) from E10.5 to E15.5. (C) Morphology of MPC1gt/gt E13.5 embryos is normal compared to MPC1+/+ and MPC1gt/+ littermates. Scale bar: 1mm. (D) Hematoxylin and eosin (H&E) staining of paraffin-embedded E13.5 embryo sections. Insets reveal lesions (arrowheads) in the pons region of the brain stem in MPC1gt/gt embryos.

