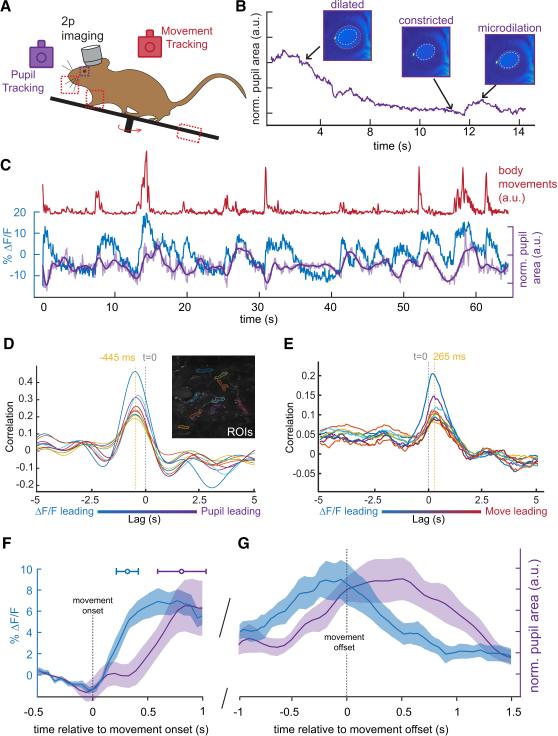
Figure 6. Movement-Related SInACh Activity Precedes Pupil Microdilations.
(A) Outline of experimental design for 2 photon imaging, tracking movements, and monitoring pupil size. (B) Changes in pupil size across time. Representative images from dilated, constricted, and microdilation periods are shown above. The dashed white circle corresponds to the size of the constricted pupil, while the orange circles illustrate the relative dilations. (C) ∆F/F from a single axon (blue) and pupil size (purple) during an epoch of small body movements (red). The lighter purple trace shows the unfiltered pupil size. (D) Cross correlation between ∆F/F of 9 ROIs and pupil microdilations. The lag between ∆F/F and pupil is indicated by the dashed orange line relative to time zero. The inset shows GCaMP labeling in SInACh axons, and the ROIs selected for analysis. (E) Cross correlation between ∆F/F of the same ROIs from (D) and movement quantification. (F-G) Average and SEM of ∆F/F (blue trace, n = 14 imaging planes, 1 axon from each; 4 mice) and pupil area (purple trace, n = 5 imaging sessions, 2 mice) plotted with respect to movement onset (F) and movement offset (G). Values are mean ± SEM (shading), except for the horizontal error bars in (F), which represent SD.

