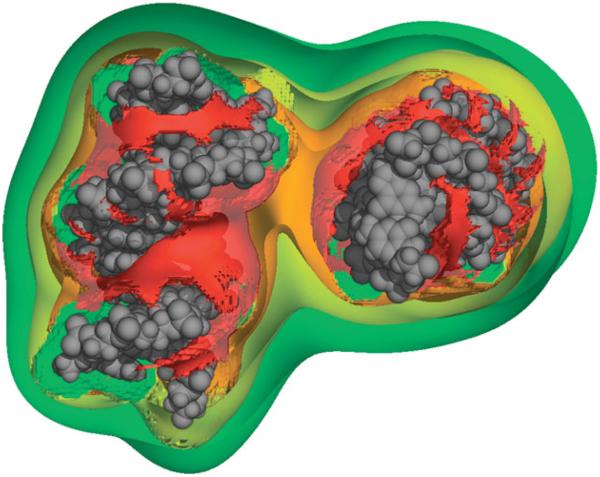
Fig. 10.
Poisson–Boltzmann predictions of counterion concentrations in the vicinity of juxtaposed 12 bp helices (Randall et al. 2006). The DNA helices are rendered in gray and oriented so that the viewer is looking down the axis of the helix on the right. Isosurfaces of the counterion concentrations are colored red (2 M), orange (1 M), yellow (0.5 M), and green (0.25 M). High concentrations of counterions `neck' in the inter-helical region as demonstrated by the orange region between the two helices. Reprinted from Randall et al. (2006) with permission.

