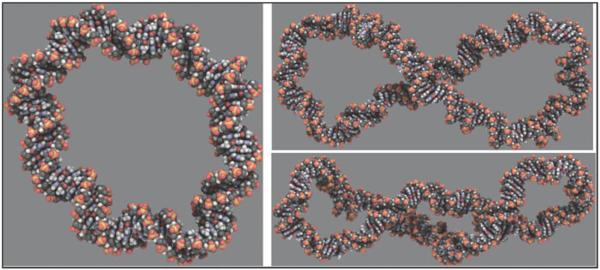
Fig. 3.
Representative structures from MD simulations of d(GC)n minicircles (Harris et al. 2008), showing a relaxed 90 bp DNA circle (left), an underwound and writhed 178 bp minicircle (top right) and an overwound and writhed 178 bp circle (bottom right). Images generated using QuteMol (Tarini et al. 2006).

