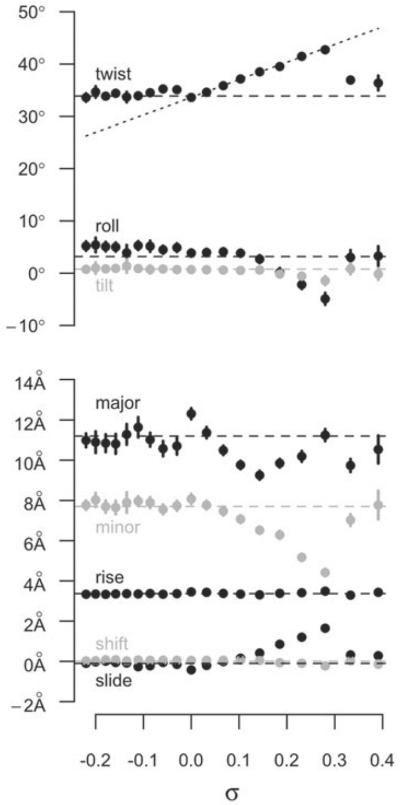
Fig. 5.
Base pair step parameters as a function of σ. The filled circles show the average values of the parameters over the last 4 ns of simulations of DNA helices with fixed σ in a system that prohibits writhe (Randall et al. 2009). The horizontal dashed lines are the values of a relaxed helix with the same sequence, as predicted by analysis of PDB structures (Olson et al. 1998). The sloped dashed line shows what the average twist would be if uniformly distributed over the length of the DNA.

